
Changes in U.S. corn area enrolled in crop insurance vary by state
- by Erik O'Donoghue
- 7/22/2014
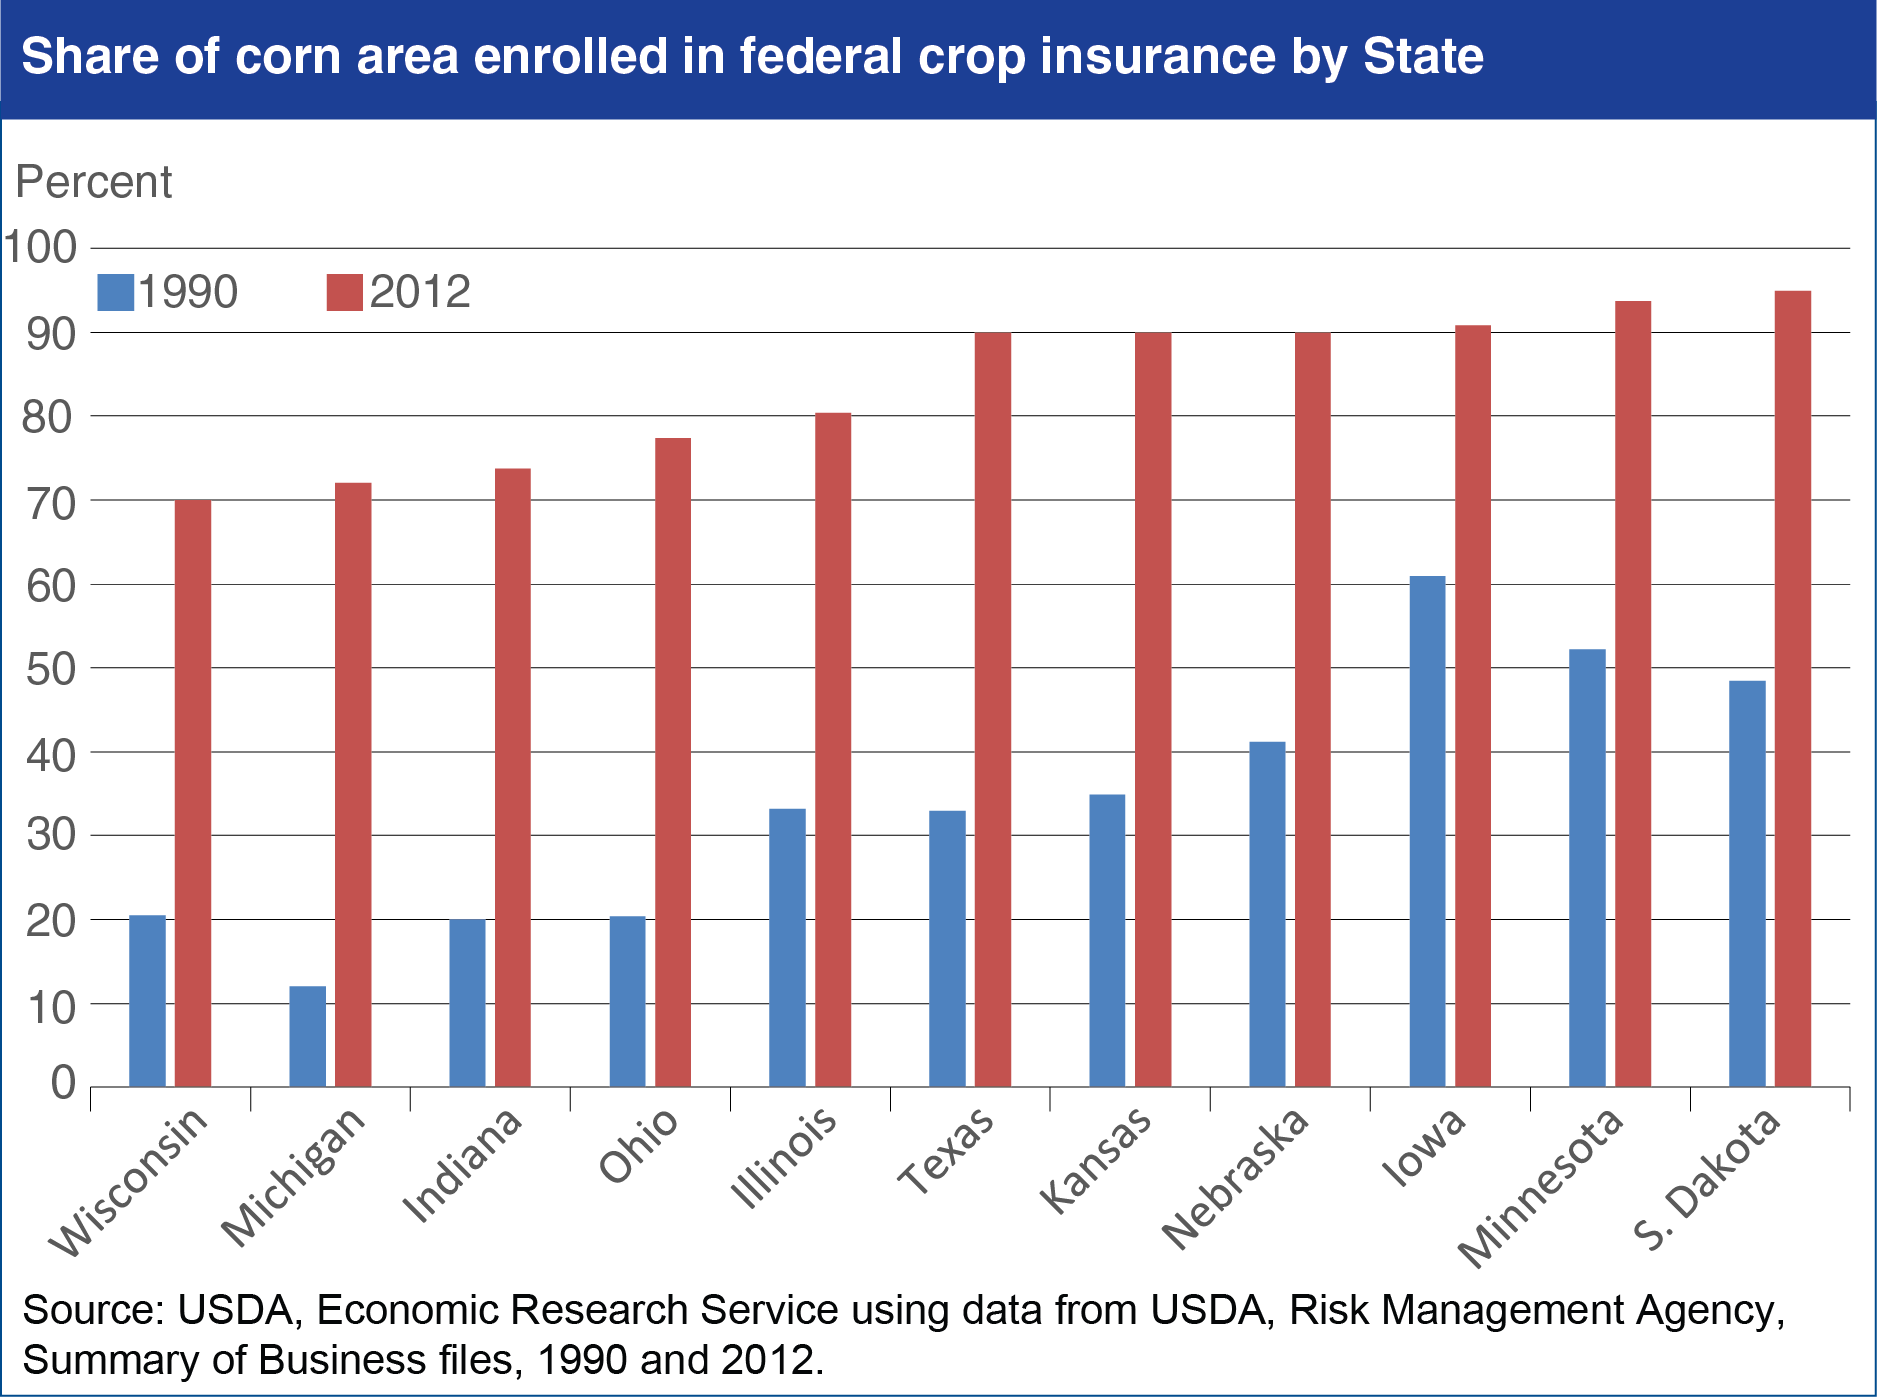
The Federal crop insurance program has grown significantly over the last 20 years, expanding from about 82 million acres in 1992 to more than 282 million acres in 2012, but changes in coverage have varied by both state and commodity. Producers of corn, soybeans, and wheat—the three largest U.S. crops—remain the largest consumers of crop insurance, although the share enrolled in other crops has been rising as new programs and policies have been offered. Federal crop insurance enrollments for corn, the largest U.S. field crop by area, are indicative of the variation in enrollment changes across states. For example, in 1990, more than 60 percent of Iowa’s corn acres were enrolled in the program, with that share rising to 91 percent by 2012. In contrast, about 20 percent of Indiana’s corn acres were enrolled in 1990, climbing to about 74 percent by 2012. The variations likely reflect both differences in production risks across states and changes in federal program provisions, including subsidies for crop insurance premiums. Despite the variation among States, the differences in coverage between states shrank between 1990 and 2012. For corn, the lowest share of acres insured within a State rose from about 12 percent in 1990 (Michigan) to 70 percent in 2012 (Wisconsin). Find additional analysis in Premium Subsidies and the Demand for Crop Insurance, released July 2014.