
New ERS data series fills gaps in away-from-home food price data
- by Aylin Kumcu
- 6/4/2014
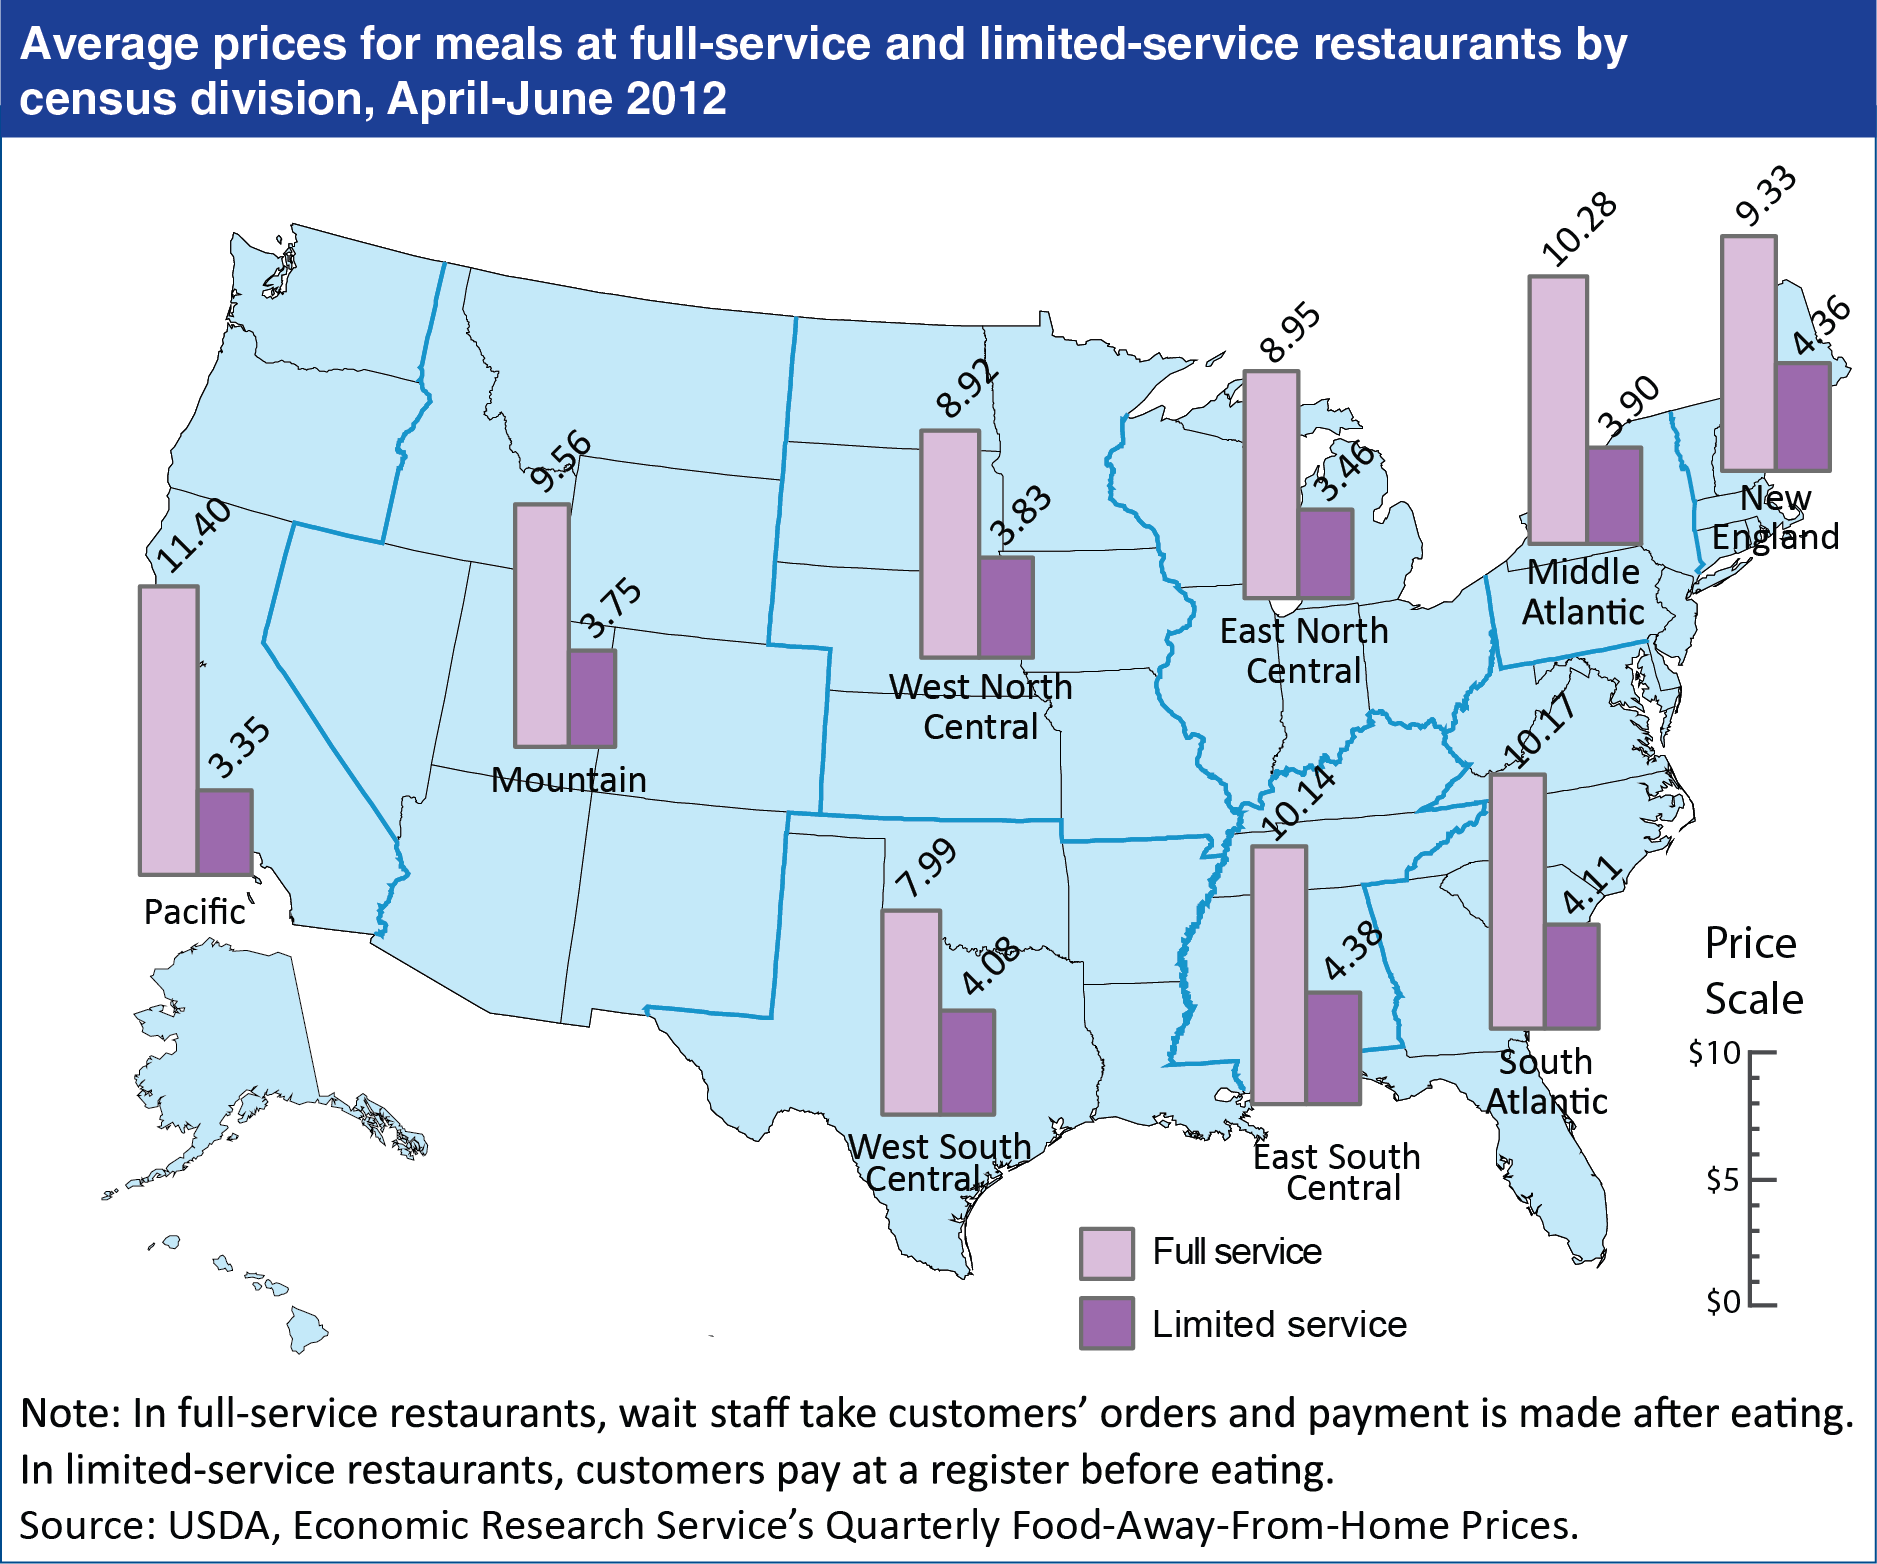
With close to one-third of Americans’ calories being eaten away from home, understanding how prices drive demand for food away from home over time and across geographic areas is a critical area of research. ERS’s new data product, Quarterly Food-Away-From-Home Prices (QFAFHP), can help support this research. The data product contains quarterly average prices for meals and products at 4 types of eating places (full-service restaurants, limited-service restaurants, vending machines, and schools) from the first quarter of 1998 to the second quarter of 2012, at the national, census region, and census division levels. In the second quarter of 2012, meals cost $9.95 on average in U.S. full-service restaurants, and $3.76 in limited-service restaurants. Full-service meals cost 43 percent more in the most expensive census division for full-service meals (Pacific) than in the least expensive division (West South Central). The Pacific had the lowest priced limited-service meals at $3.35, while the East South Central division had the highest at $4.38, a difference of 31 percent. More information on ERS’s QFAFHP data product can be found in Methodology for the Quarterly Food-Away-From-Home Prices Data, released on May 21, 2014.
We’d welcome your feedback!
Would you be willing to answer a few quick questions about your experience?