
Prevalence of very low food security rose in most States from 2002 to 2012
- by Elizabeth Beaulieu
- 5/12/2014
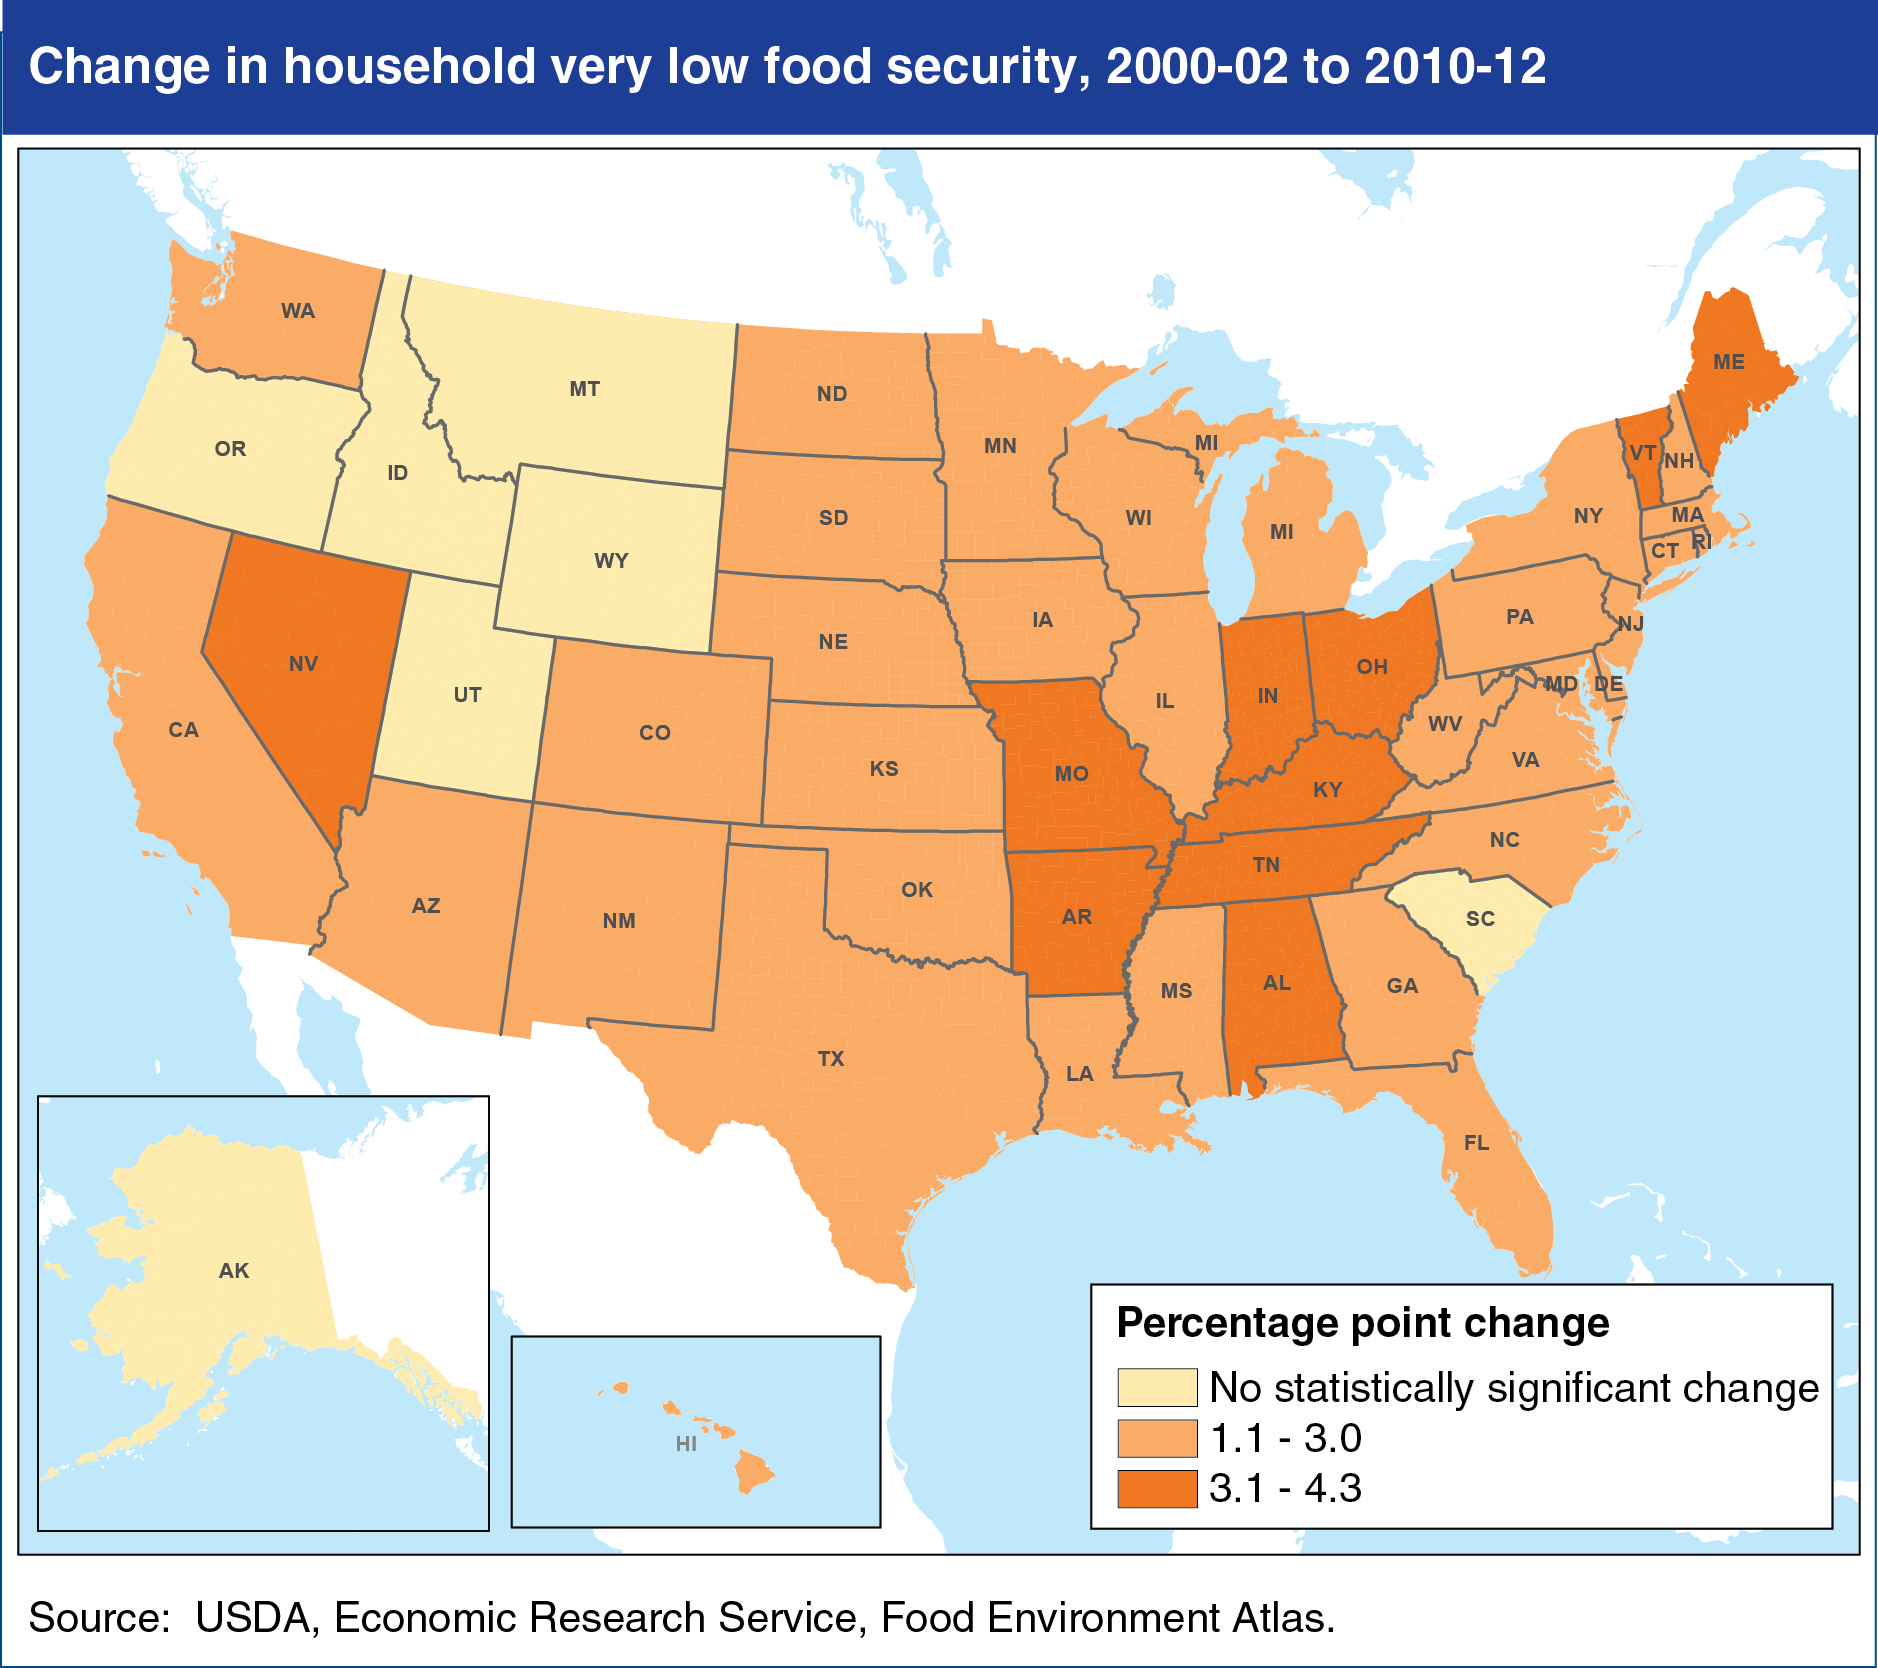
From 2000-02 to 2010-12, the percentage of households with very low food security increased in all but seven States, reflecting the tough economic times of the 2007-09 recession and its lingering effects. Food security is defined as “very low” when the food intake of some household members is reduced and normal eating patterns are disrupted at times during the year because of limited resources. The prevalence of very low food security in 2010-12 (data for 3 years were combined to provide more reliable State-level statistics) ranged from 3.2 percent in Virginia to 8.1 percent in Arkansas, with an average of 5.6 percent across all States. From 2000-02 to 2010-12, increases in very low food security exceeded 4 percentage points in only Maine and Missouri, raising the prevalence of very low food security in those States to 7.1 percent and 7.6 percent, respectively. The magnitude of change does not necessarily indicate the extent of very low food security in 2010-12, because levels were not uniform across States at the beginning of the decade. The data for this map come from ERS’s Food Environment Atlas.