
U.S. agricultural exports nearly tripled from 2000 to 2013
- by Stephen MacDonald
- 2/12/2014
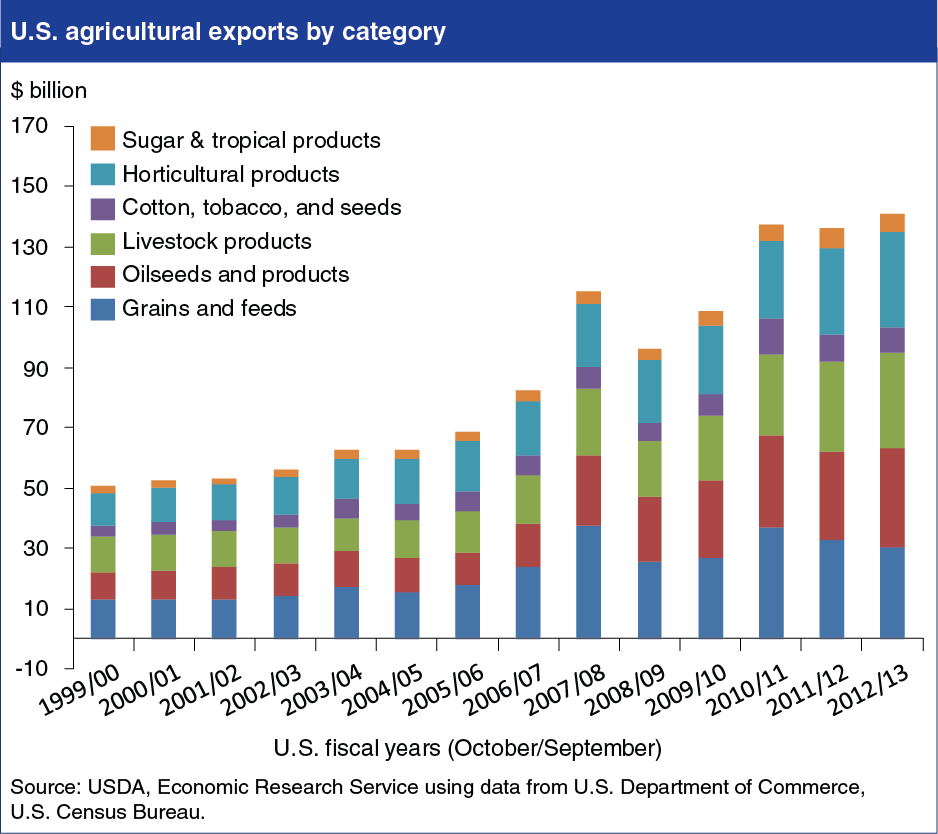
U.S. agricultural exports nearly tripled between 2000 and 2013, reaching a record $140.9 billion in U.S. fiscal year 2012/13 (October/September). Growth has, to a large extent, been driven by higher incomes and rising food and feed demand in developing countries. Sales to developing countries were up about 250 percent between 2000 and 2013, and they now account for two-thirds of U.S. agricultural exports. Rising prices have been the other key driver of growth in U.S. agricultural exports. Both rising demand from the growing middle classes of developing countries and the falling value of the dollar have been important factors in boosting the world market prices of grains, oilseeds, and cotton—the traditional bulk commodities. Between 2000 and 2013, the volume of bulk commodities shipped from the United States actually fell slightly, but their value rose almost 8 percent annually. High-value product (HVP) exports rose even more than bulk products in value terms, and the value of U.S. agricultural exports in 2013 was still more heavily concentrated in livestock, horticultural and other HVPs than in bulk products. For HVP exports, developing countries have also played a larger role than developed country markets. The share of U.S. HVP exports directed to developing countries rose from 54 percent in 2000 to 58 percent in 2013. This is an updated version of a chart found in Ag and Food Statistics: Charting the Essentials.