
Incomes fell for U.S. families in all income groups between 2007 and 2012
- by Tracey Farrigan
- 1/30/2014
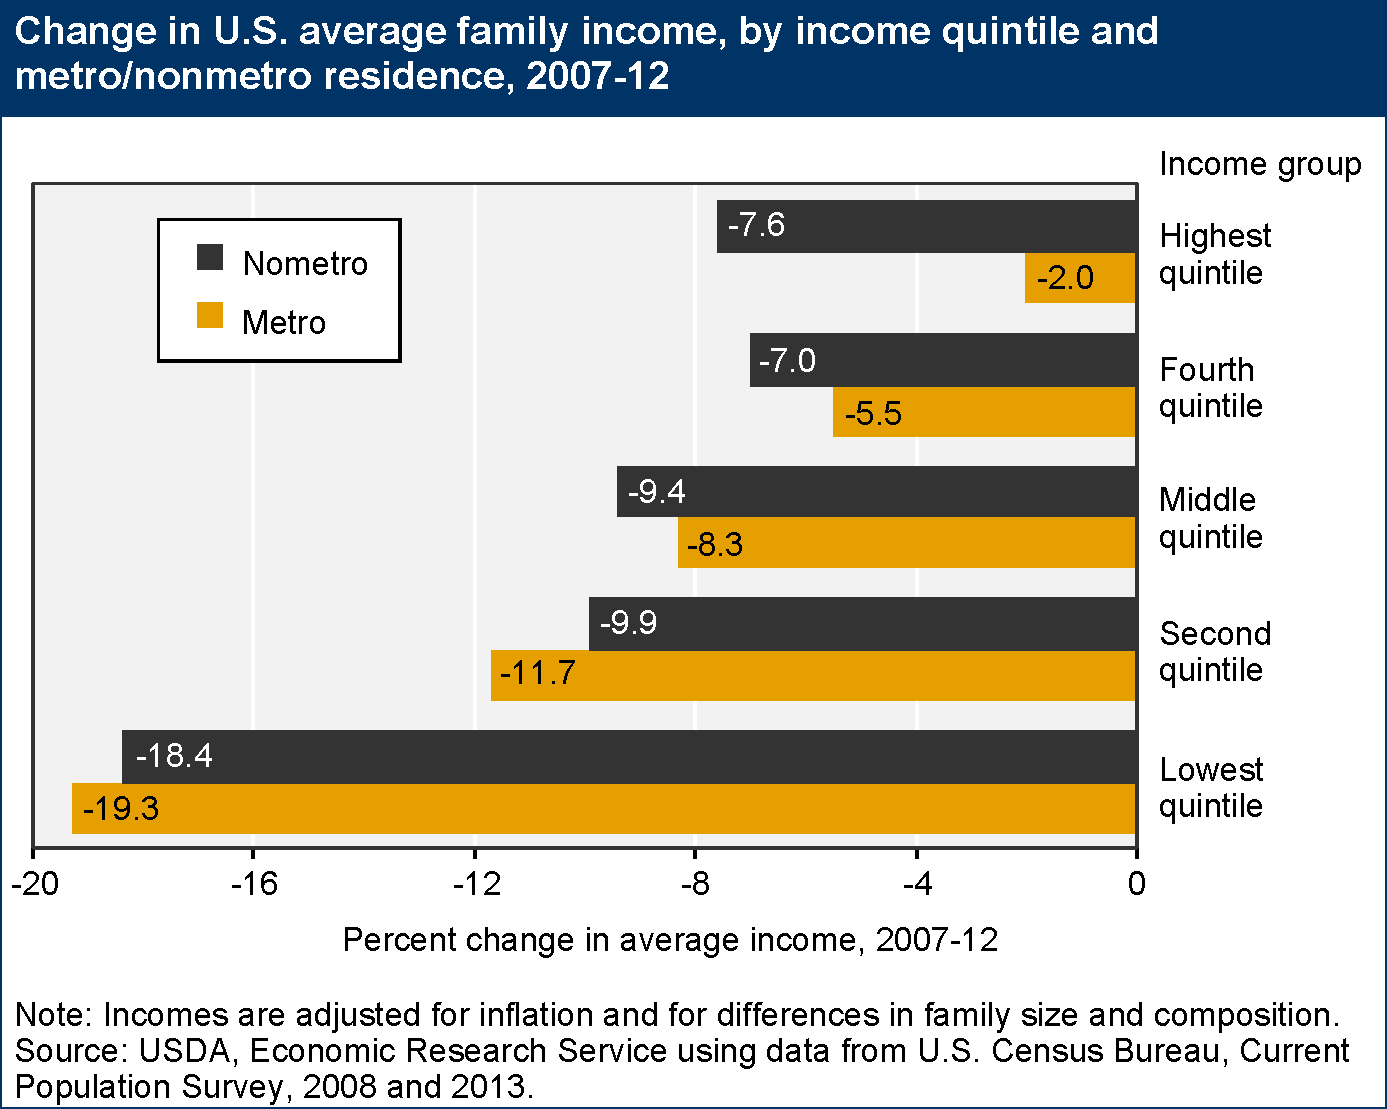
According to U.S. Census data, income inequality has been growing in the U.S. since 1968. Income changes since the onset of the 2007-09 recession demonstrate a continuation of this trend. Average family income fell for all income quintiles between 2007 and 2012, but it fell at a higher rate among lower-income families. In 2012, the average income of the 20 percent of families with the lowest incomes was nearly 20 percent below its 2007 level, reflecting persistently high unemployment rates and declining wages in many lower-income occupations. Income declines were generally smaller at higher income levels, particularly among metro residents, where average income for the highest income quintile increased since 2010 (not shown in graph). By contrast, average incomes among high-income nonmetro families continued to fall during 2010-12. The net effect of these changes was an increase in income inequality over the period, most noticeably in metro areas. This chart is an update of one found in Rural America At A Glance, 2012 Edition, EB-21, December 2012.