
Minorities represent a lower share of rural veterans than of the rural population
- by Economic Research Service
- 12/19/2013
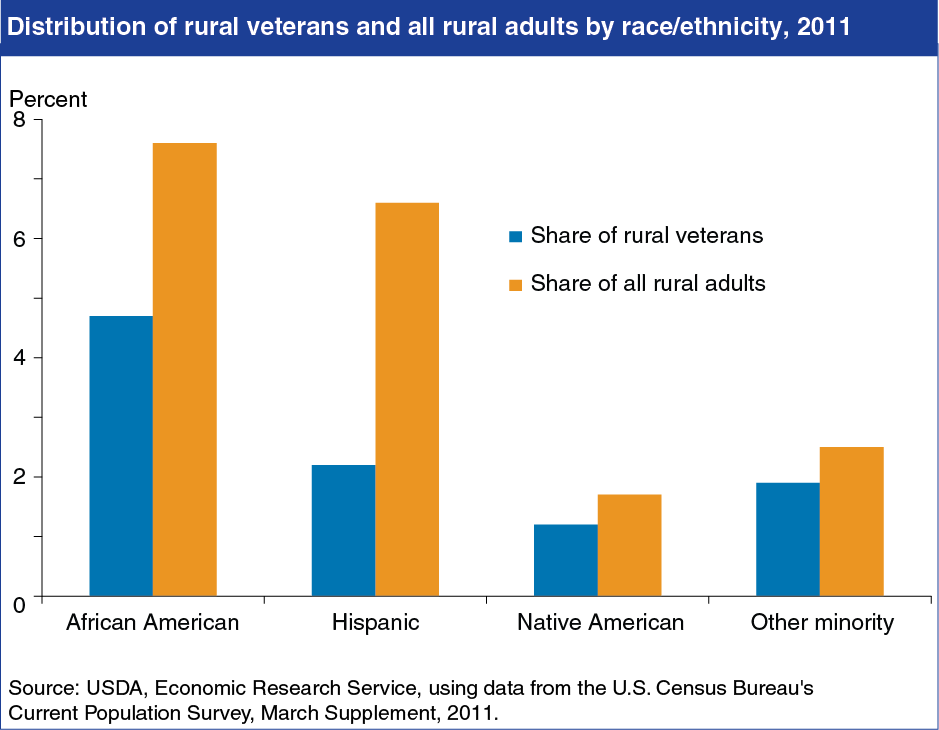
Between 1992 and 2011, the share of rural veterans representing racial-ethnic minorities increased from 6 to 10 percent. Despite this increase, rural minorities remain under-represented relative to their 18.4-percent share of the adult rural population. For example, while Hispanic men and women accounted for 7 percent of the rural population in 2011, they represented only about 2 percent of rural veterans that year. Rapid population growth in the 1980s and 1990s among rural Hispanics was led by young-adult job seekers, mostly foreign-born—these newcomers were typically less inclined to volunteer for military service and were less likely to meet the military’s enlistment requirements. Rural Hispanic immigrants have been aging into family formation, settling into permanent residence, and raising children who may be more inclined to consider and qualify for military service. African Americans and Native Americans also account for a lower share of rural veterans relative to their share of the rural population, although the gap is less pronounced. This chart is found in the ERS report, Rural Veterans At A Glance, EB-25, November 2013.