
Net farm income and production expenses are forecast to continue upward trend
- by Economic Research Service
- 11/26/2013
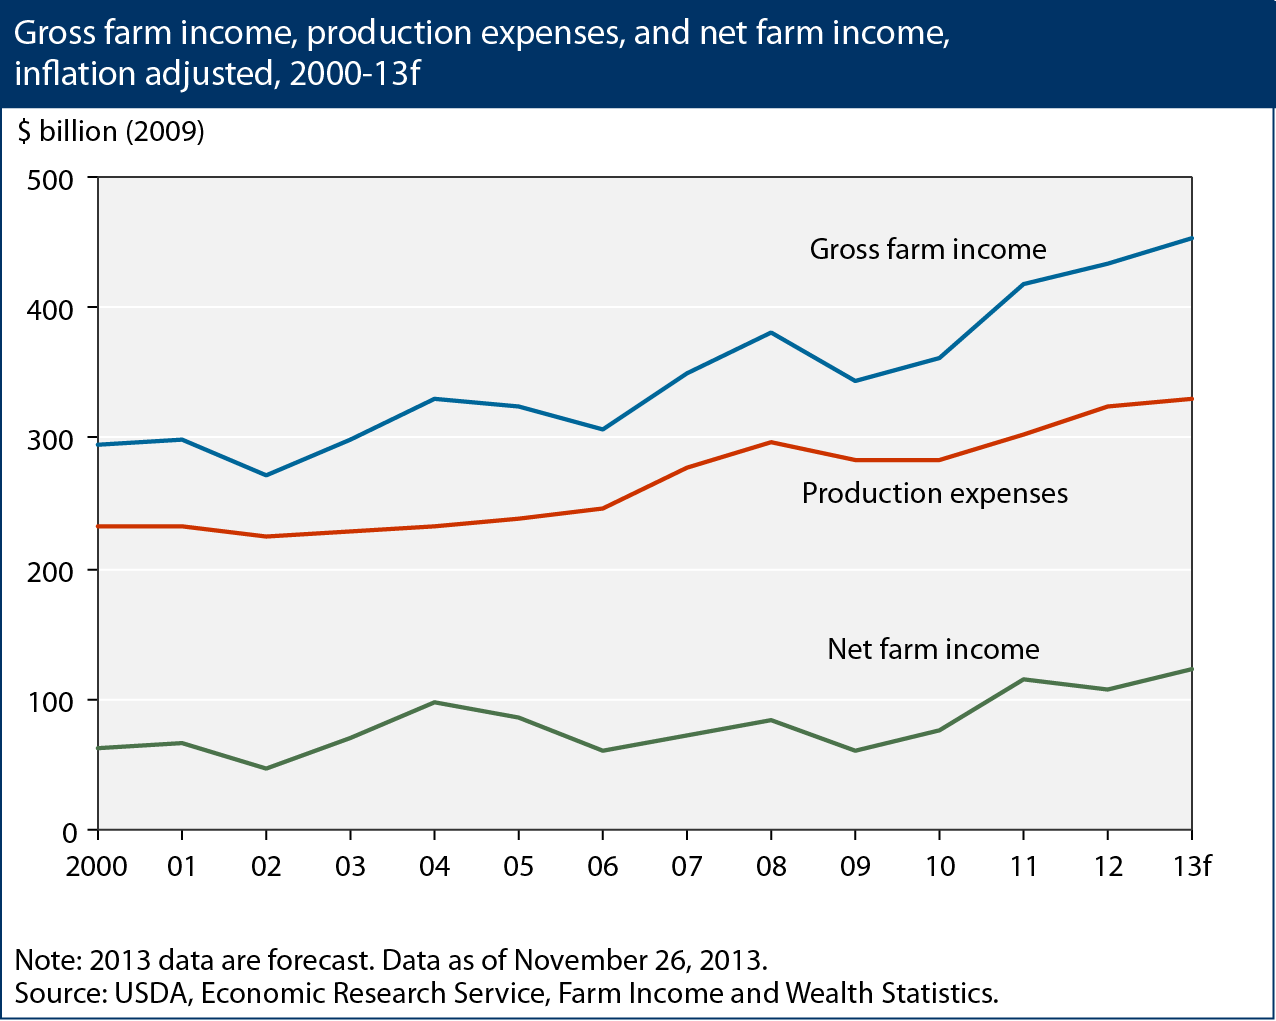
While gross farm income roughly measures the total value of agricultural output, it does not reflect the farm sector’s contribution to that value, nor does it measure the income earned by farm operators and other farm sector stakeholders. Net farm income—which reflects income from production in the current year—is calculated by subtracting farm expenses from gross income. Whether measured in current or inflation-adjusted dollars, net farm income has been trending upward. In 2013, net farm income is forecast to reach $131 billion. When adjusted for inflation, this represents an increase of over 150 percent since 2000, and is the highest inflation-adjusted net farm income level since 1973. This chart is found in Ag and Food Statistics: Charting the Essentials on the ERS website.