
Nonmetro poverty at its highest in more than 25 years
- by Economic Research Service
- 9/19/2013
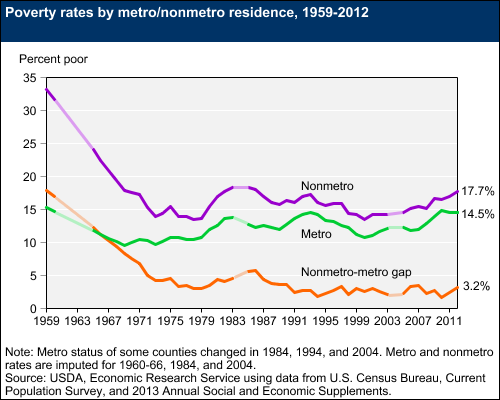
Nonmetro areas have had a higher rate of poverty than metro areas since the 1960s, when poverty rates were first officially recorded. Over time, the difference between nonmetro and metro poverty rates has fluctuated, falling from an average difference of 4.5 percentage points in the 1980s to a record low of 1.6 percentage points in 2010, as the metro poverty rate rose faster than the nonmetro rate over 2006-10. Because of the uneven economic recovery following the 2007-09 economic recession, nonmetro poverty rose slightly in 2011 (to 17.0 percent) and again in 2012 (to 17.7 percent), while the poverty rate fell slightly in metro areas. As a result, the nonmetro poverty rate is at its highest level since 1986 and is now 3.2 percentage points higher than the metro poverty rate. This chart is an updated version of one found in the Rural Poverty and Well-Being topic page on the ERS website.