
Farm share of U.S. food dollar reflects production and marketing costs, along with eating habits
- by Economic Research Service
- 7/22/2013
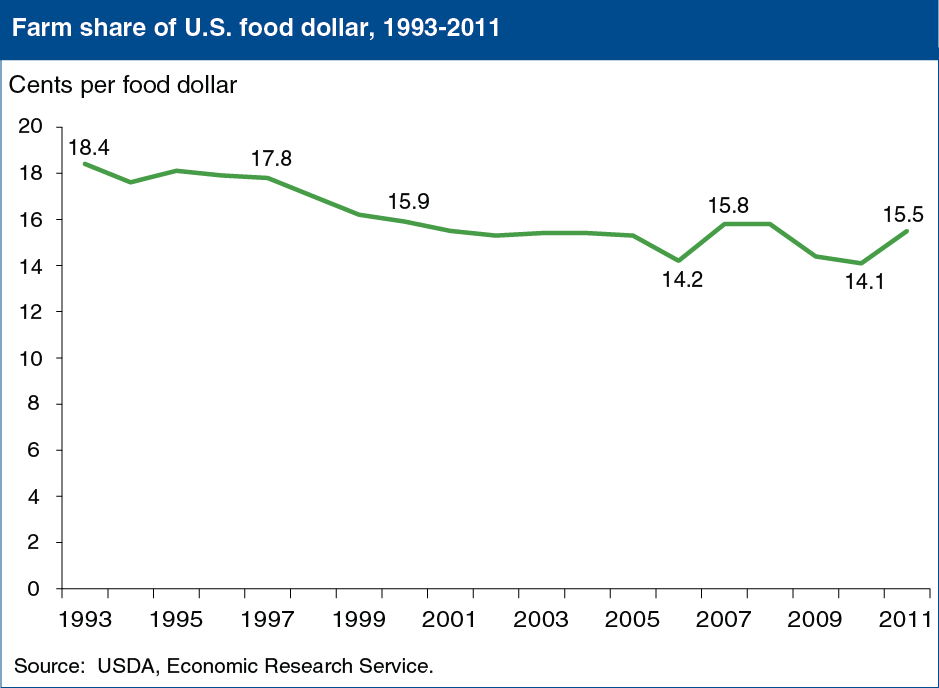
ERS’s marketing bill series splits the total U.S. food dollar into two parts: a farm share of every $1 spent on domestically produced food (including grocery store purchases and eating out) and a post-farm gate marketing share. Over time, the farm share—or costs of producing the farm commodities that go into an average dollar’s worth of food—varies in response to changes in commodity prices and costs for farm-level inputs; costs for marketing inputs such as packaging materials, fuel, and processing services; the types of foods Americans eat; and the frequency with which they eat out. ERS’s revised marketing bill series, which covers 1993 to the present, shows the farm share mostly trending downward, beginning the period at 18.4 cents and remaining below 16 cents since 2000. In 2011, the farm share was 15.5 cents, up from 14.1 cents in 2010 and comparable with levels in 2007-08. This chart appears in "ERS Food Dollar Series Allows an Indepth Look at Farm-Level Components of the U.S. Food Dollar” in the July 2013 issue of Amber Waves magazine.
We’d welcome your feedback!
Would you be willing to answer a few quick questions about your experience?