
Farms involved in rural development related activities vary by type of activity
- by Economic Research Service
- 3/28/2013
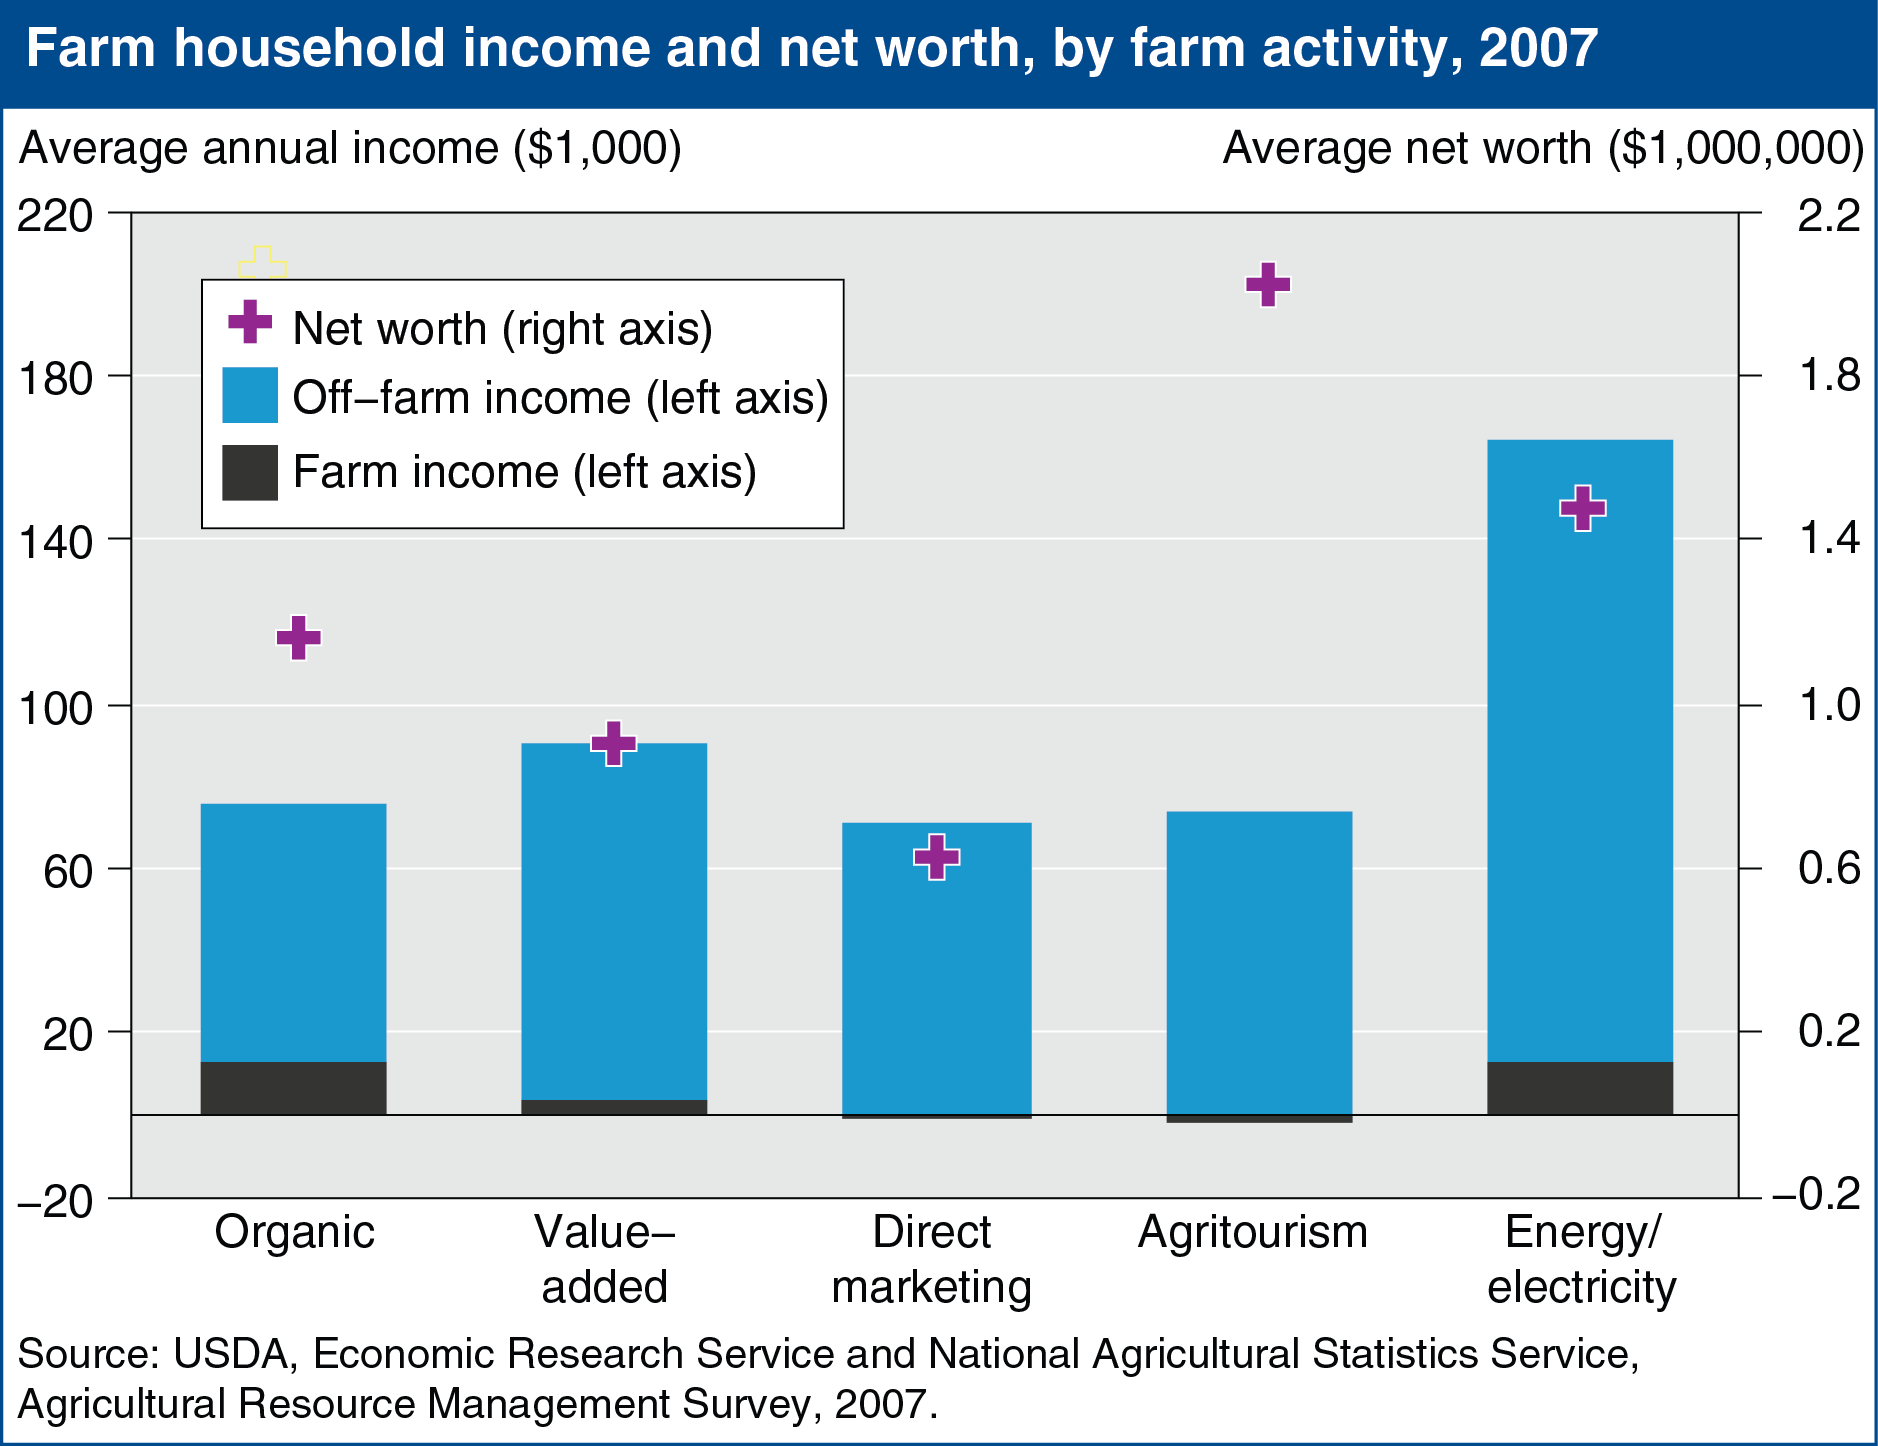
While rural development efforts generally focus on the nonfarm economy in the United States, over the last 10 years, several USDA Rural Development programs have put increased emphasis on funding farm-related business activities associated with renewable energy, local/regional food industries, and the use of farm and ranch natural resources. Using data from the 2007 Agricultural Resource Management Survey, the characteristics of farms involved in organic farming, value-added agriculture, direct marketing, agritourism, and energy/electricity production are compared in this chart. Household wealth and income are important indicators of financial capacity, or the ability to make financial investments in farm activities. Average farm household net worth was highest for agritourism farms ($2.0 million) and lowest for direct marketing farms ($631,000). Total household income exhibited a different pattern and was highest for energy/electricity farms ($165,000 annually) and value-added farms ($90,000 annually), on average. The income generated by these rural development-related activities is considered part of farm income (which was highest, on average, for energy/electricity and organic farms, and negative for agritourism farms). This chart comes from the ERS report, Farm Activities Associated With Rural Development Initiatives, ERR-134, May 2012.