
Productivity growth in food manufacturing is low relative to manufacturing in general
- by Keith Fuglie
- 1/28/2013
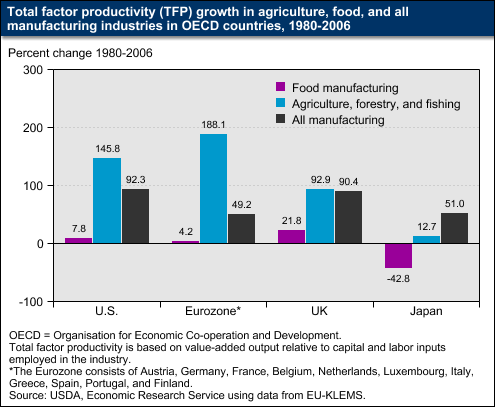
Productivity growth in food manufacturing has been far below growth rates for agriculture and manufacturing as a whole in the world’s major economies over the past three decades. Total factor productivity (TFP) measures the value added per combined unit of labor and capital employed in an industry. From 1980 to 2006, TFP growth in food manufacturing was substantially below that for total manufacturing and agriculture in the United States, the United Kingdom (UK), the “Eurozone,” and Japan. Only in the UK did food manufacturing productivity increase more than minimally; in Japan, productivity growth in food manufacturing was negative over this period. The TFP changes shown in the graph indicate the rate of capital- and labor-saving technical change in each industry, and reveal that relatively little of this innovation occurred in food manufacturing. This chart is based on data found in table 9.3 of Research Investments and Market Structure in the Food Processing, Agricultural Input, and Biofuel Industries Worldwide, ERR-130, December 2011.
We’d welcome your feedback!
Would you be willing to answer a few quick questions about your experience?