
Market penetration by farmers' markets varies geographically
- by Mark Jekanowski
- 1/25/2013
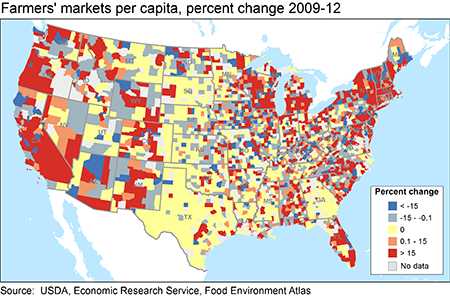
Farmers’ markets are a significant source of fresh fruit, vegetables, meats, and other items sold directly from the producer or farmer to U.S. consumers. Data from August 2012 show that across much of the United States the number of farmers’ markets continues to grow. Since 2009, counties that showed the largest increase in the number of farmers’ markets per capita tended to be near urban areas, particularly along the East and West coasts and in the historically industrialized parts of the Midwest. But counties where the number has declined relative to population are often adjacent to or surrounded by those that showed the largest growth, suggesting that these local markets are dynamic and heterogeneous despite their geographic similarities. Areas where the density of these markets relative to population is the most stable tend to be in the most sparsely populated parts of the country, likely reflecting a population density too small to make new or additional markets economically viable. This map is from ERS’s Food Environment Atlas.