
Nonmetro high poverty areas are regionally concentrated
- by Tracey Farrigan and Timothy Parker
- 12/20/2012
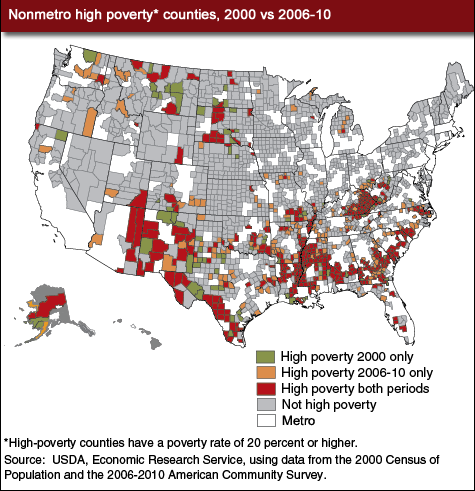
Nonmetro high-poverty areas—counties with a poverty rate of 20 percent or higher—tend to be clustered into groups of contiguous counties that reflect distinct regional concentrations. High levels of nonmetro poverty are pervasive in the South, particularly in the Cotton Belt, Southern Appalachia, the Rio Grande, and the Mississippi Delta. Poverty rates are typically highest at the cores of these high-poverty clusters and then taper off gradually toward the edges. There were 193 nonmetro counties newly defined as high poverty in 2006-10. Most of the new nonmetro high-poverty counties are adjacent to previously existing high-poverty clusters. Findings also reveal an emerging nonmetro high-poverty region in the Pacific Northwest and a more dispersed pattern of new high-poverty counties elsewhere in the West and the Midwest. This suggests that not only has the incidence of concentrated nonmetro poverty increased over the last decade but that it has also become more widespread. This map is found in the December 2012 Amber Waves magazine.