
Unemployment rates vary Nationally
- by Economic Research Service
- 5/9/2012
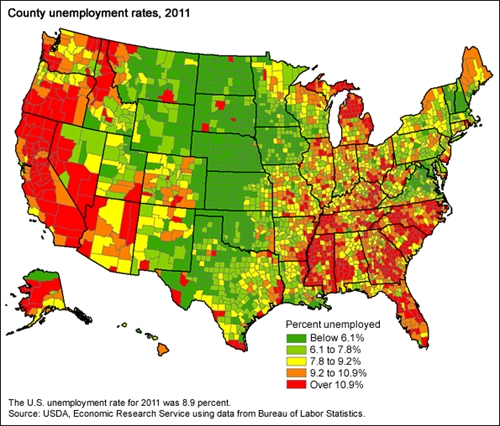
The U.S. annual average unemployment rate fell from 9.6 percent in 2010 to 8.9 percent in 2011. In rural (nonmetro) counties, the average unemployment rate fell to 8.4 percent in 2011, down from 9.2 percent in 2010. Urban (metro) counties also saw a decline in unemployment, which went from 9.7 percent in 2010 to 9.0 percent in 2011 (see this previous Chart of Note). In 2011, North Dakota had the lowest unemployment rate (3.5%) while Nevada had the highest (13.5%). The lowest county-level unemployment rates were in the Great Plains, where the combination of strong agricultural prices and a boom in energy production have helped job growth. This map is based on County-Level Unemployment and Median Household Income data on the ERS website, updated May 2012.