
Nonmetro unemployment down in 2011
- by Economic Research Service
- 3/8/2012
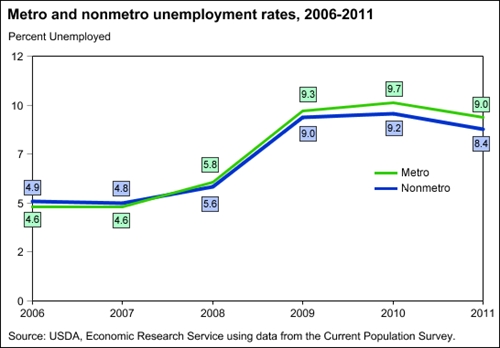
The nonmetro unemployment rate, which rose for 10 consecutive quarters starting in mid-2007, fell to 8.4 percent in 2011. Metro unemployment also trended downward to 9.0 percent in 2011. Although 2011 annual average unemployment rates for both metro and nonmetro areas are currently below their recent peaks, they remain well above pre-recession levels. The last time unemployment rates exceeded 2009-11 levels was during the 1980-82 recession when unemployment rates reached 10.1 percent in nonmetro areas and 9.5 percent in metro. This chart is an update of one from the 2011 edition of Rural America At A Glance, EIB-85, September 2011.