
Farms' net income and solvency position
- by Economic Research Service
- 1/26/2012
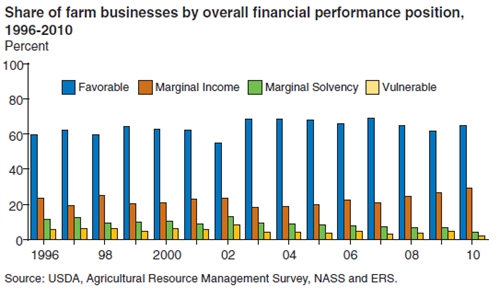
Two percent of farms were classified as being in a vulnerable position on December 31, 2010, having both negative net cash income and a debt-to-asset ratio over 0.4. More farms (29 percent) were classified as being in a marginal-income position as a result of having negative net cash incomes, but a debt-to-asset ratio of 0.4 or less. The share of all U.S. farms classified as vulnerable has dropped since 1986 (the year when combined net farm income and balance sheet statements were first available for farm businesses), when nearly 12 percent of farms were in a vulnerable financial position. The share of farms classified as vulnerable has dropped in this decade to the lowest levels that ERS has recorded, as a result of expanding income levels and shrinking debt in relation to asset values. At the other extreme, about 65 percent of farms were in a favorable financial position entering 2011. These farms had both positive income and relatively low farm debt. For comparative purposes, 48 percent of farms were classified as favorable in 1986. This chart may be found in Agricultural Income and Finance Outlook, AIS-91, December 2011.