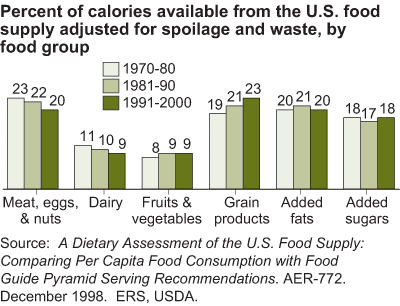
Percent of calories available from the U.S. food supply adjusted for spoilage and waste, by food group
- by Jean C. Buzby
- 4/18/2014

Percent of calories available from the U.S. food supply adjusted for spoilage and waste, by food group
