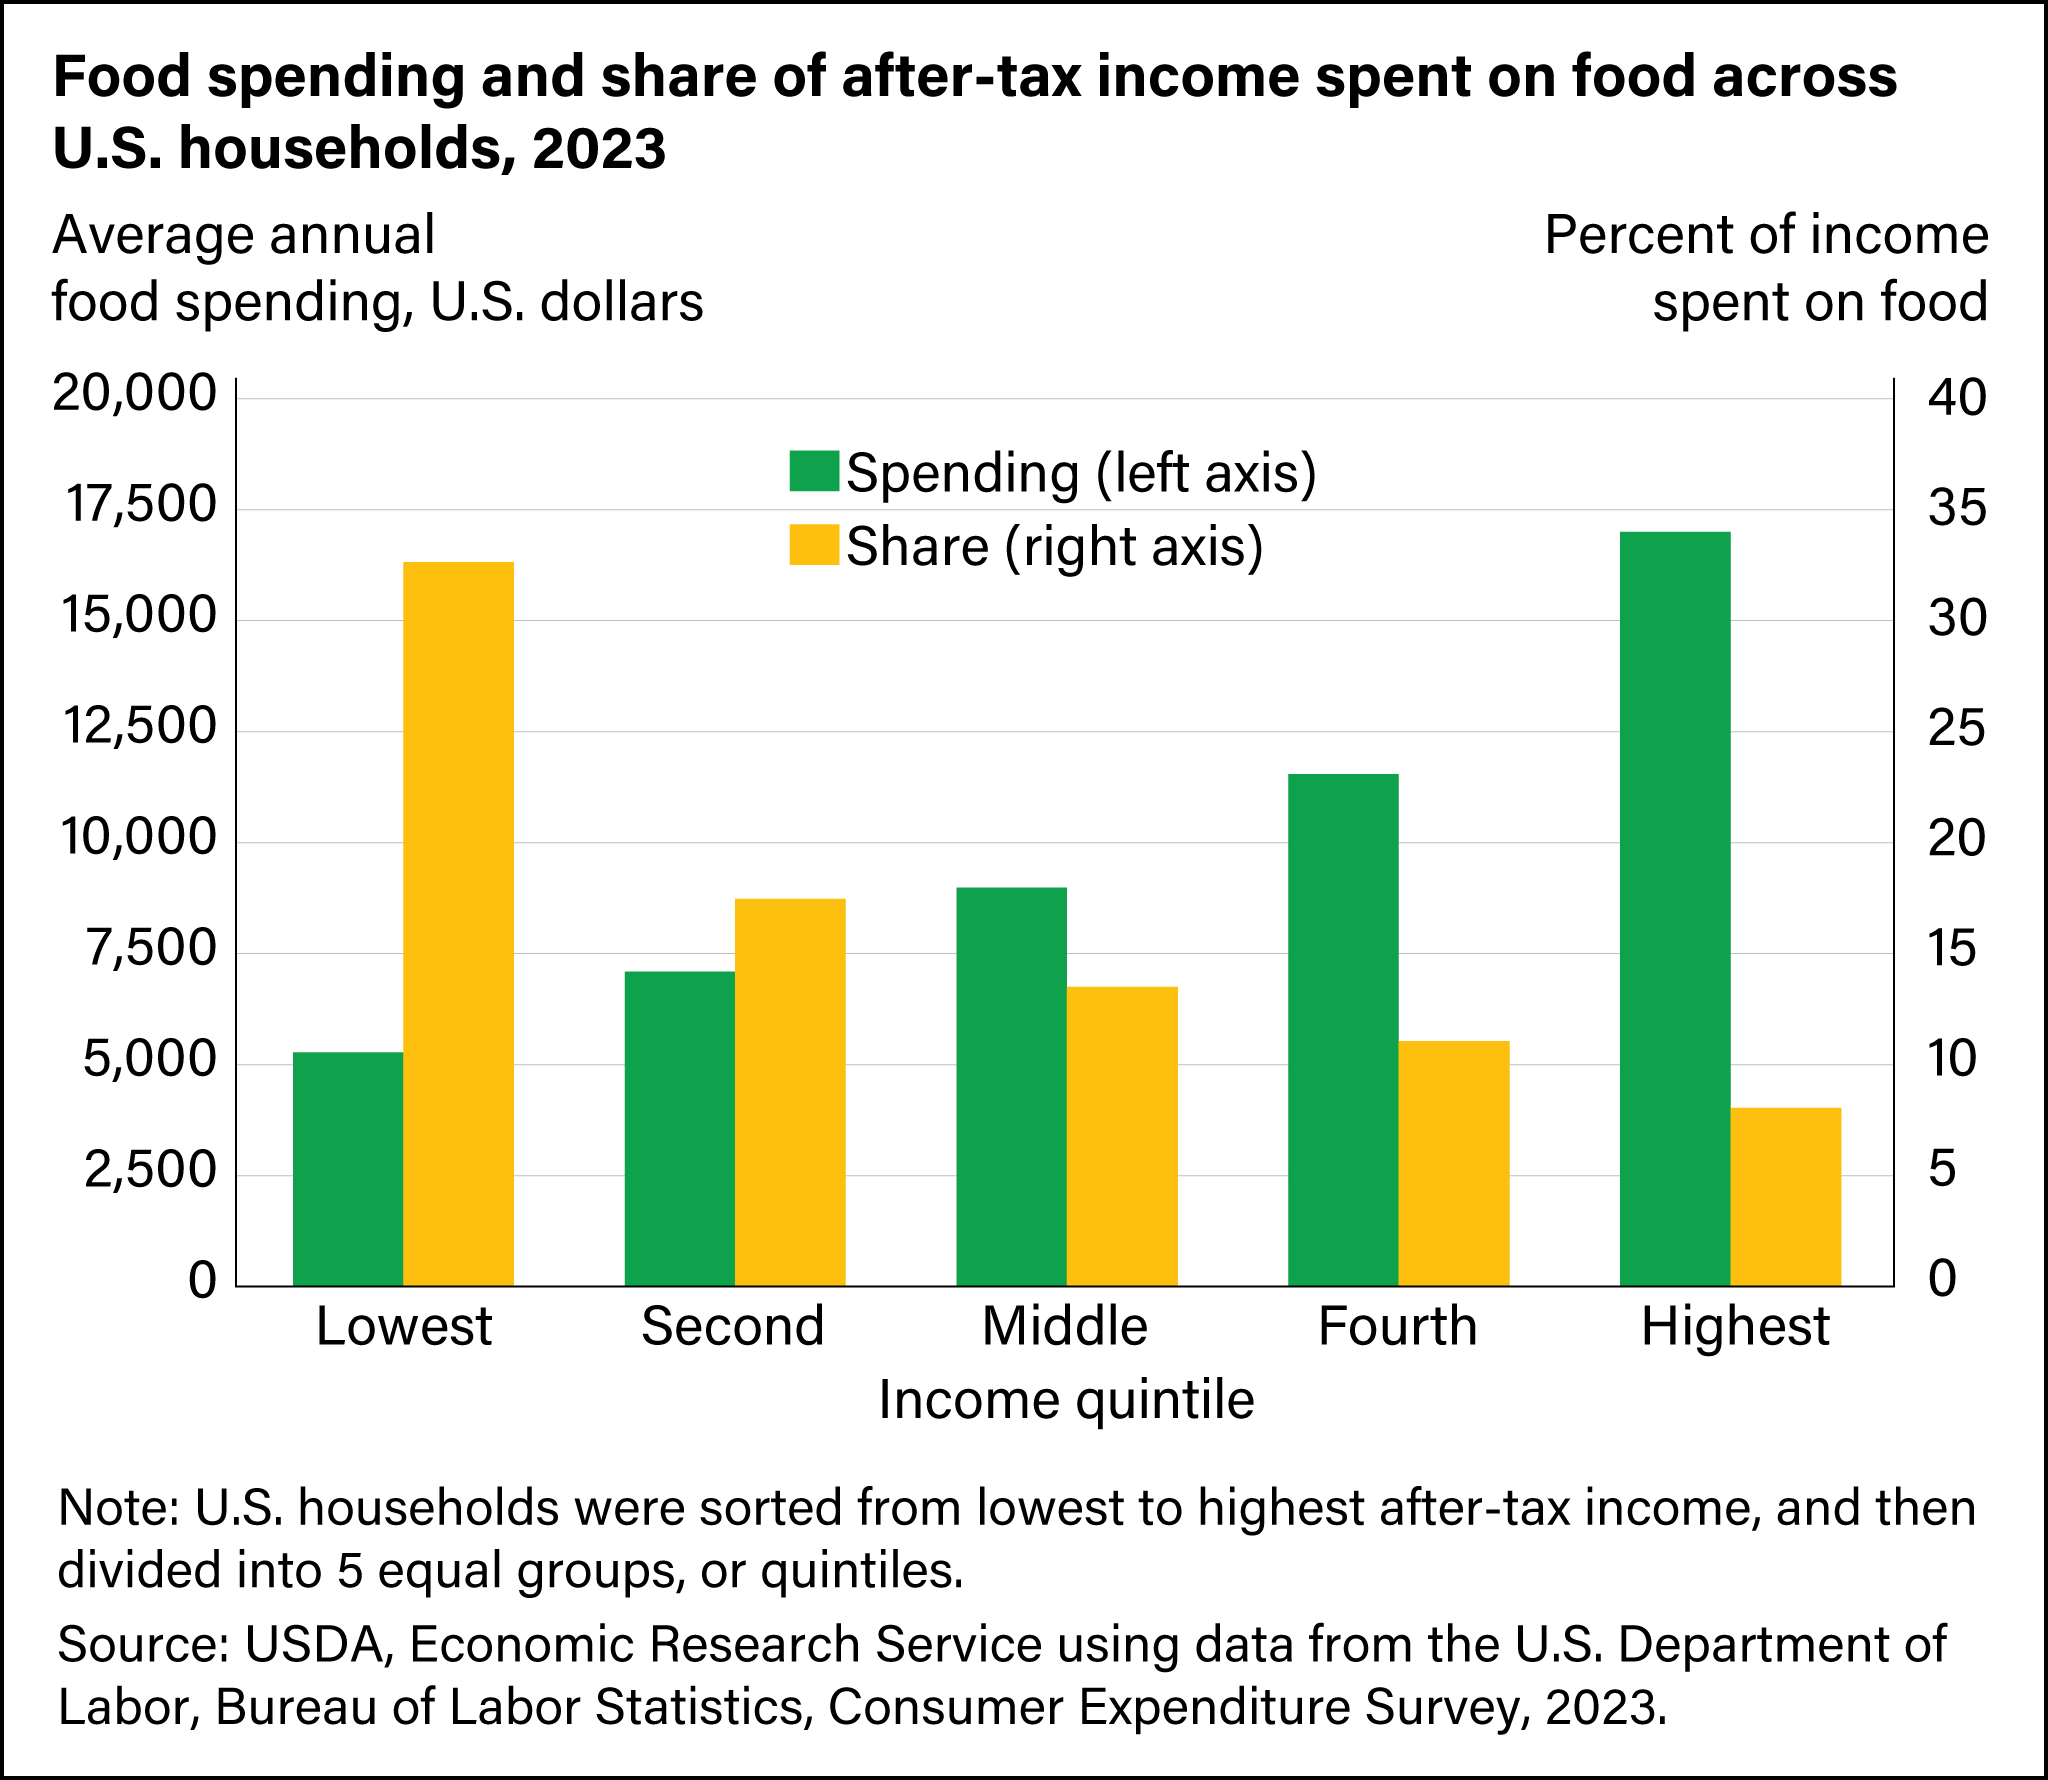
Food spending as a share of income declines as income rises
- by Megan Sweitzer and Victoria Davidenko
- 11/1/2024

As their incomes rise, U.S. households spend more money on food, but it represents a smaller share of their income. In 2023, households in the lowest income quintile spent an average of $5,278 on food (representing 32.6 percent of after-tax income). Households in the middle income quintile spent an average of $8,989 on food in 2023 (representing 13.5 percent of after-tax income). In 2023, households in the highest income quintile spent an average of $16,996 on food (representing 8.1 percent of after-tax income).
