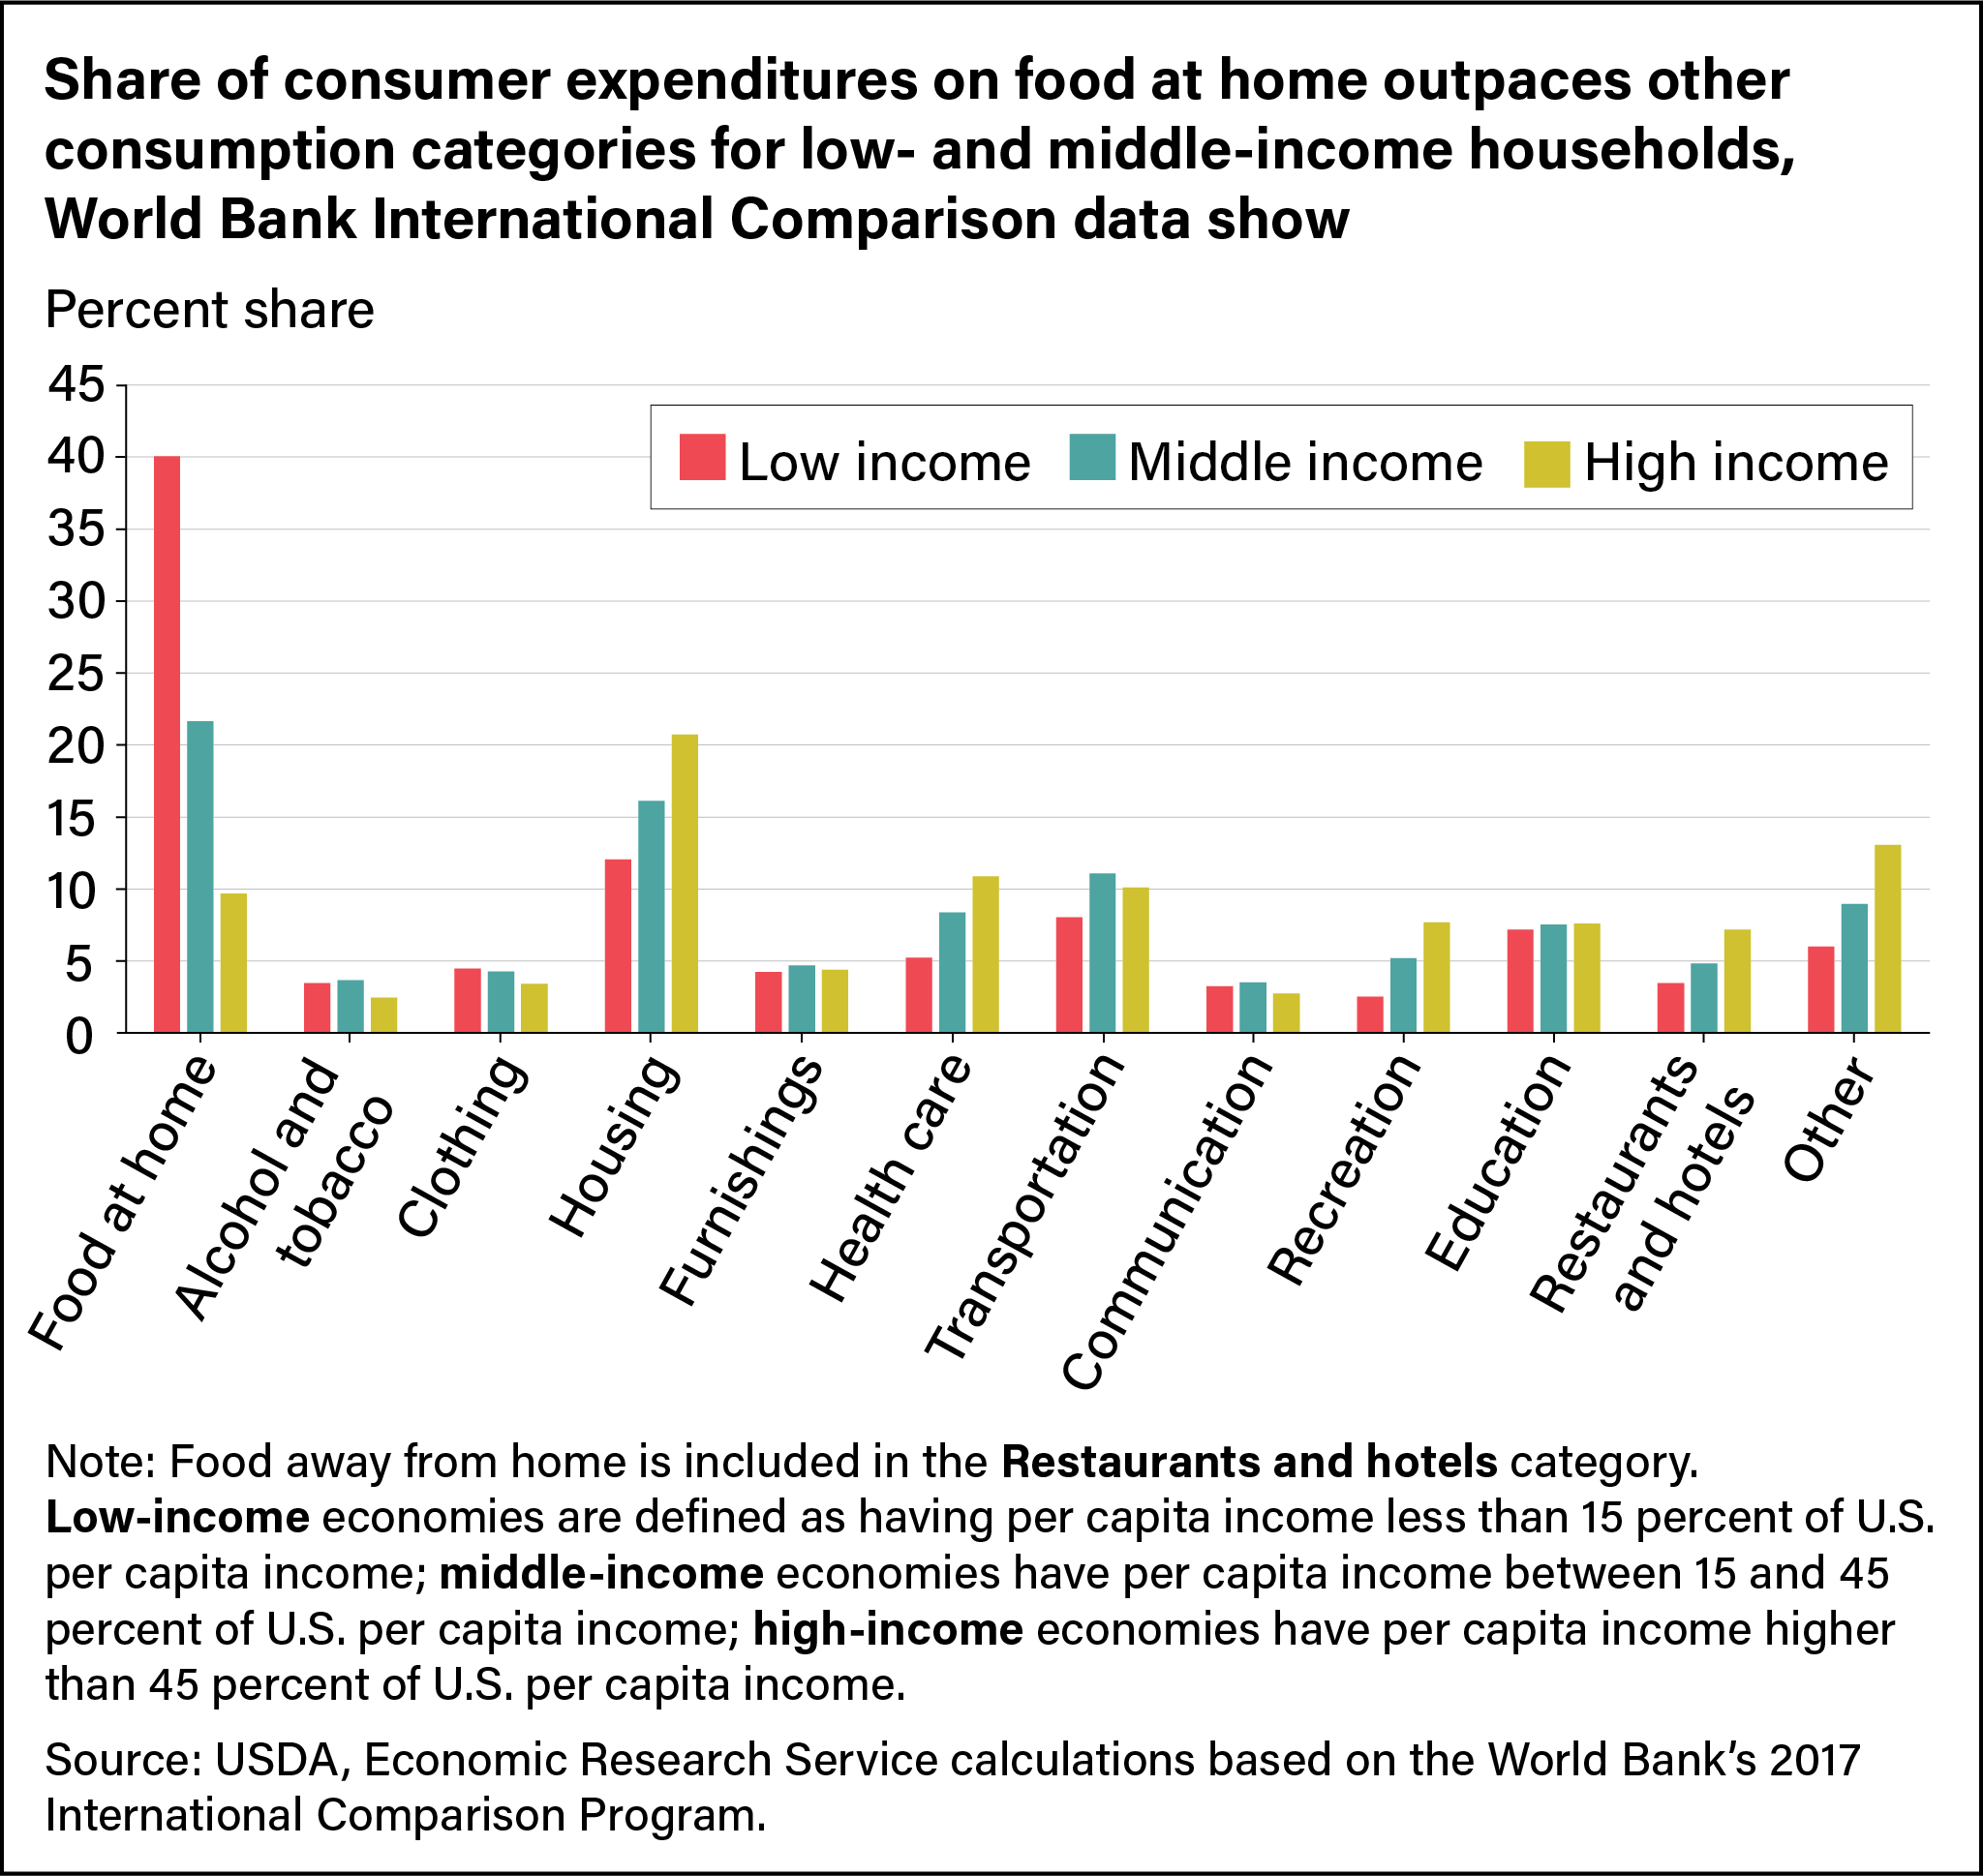
Share of consumer expenditures on food at home outpaces other consumption categories for low- and middle-income households, World Bank International Comparison data show
- by Ron Sands
- 6/20/2024

As world population and incomes rise, patterns of global food consumption are shifting, as measured by calories available per capita. Large differences exist among countries for total calories available and for each of these four food groups: animal products, fruit and vegetables, oils and sweeteners, and grains.
