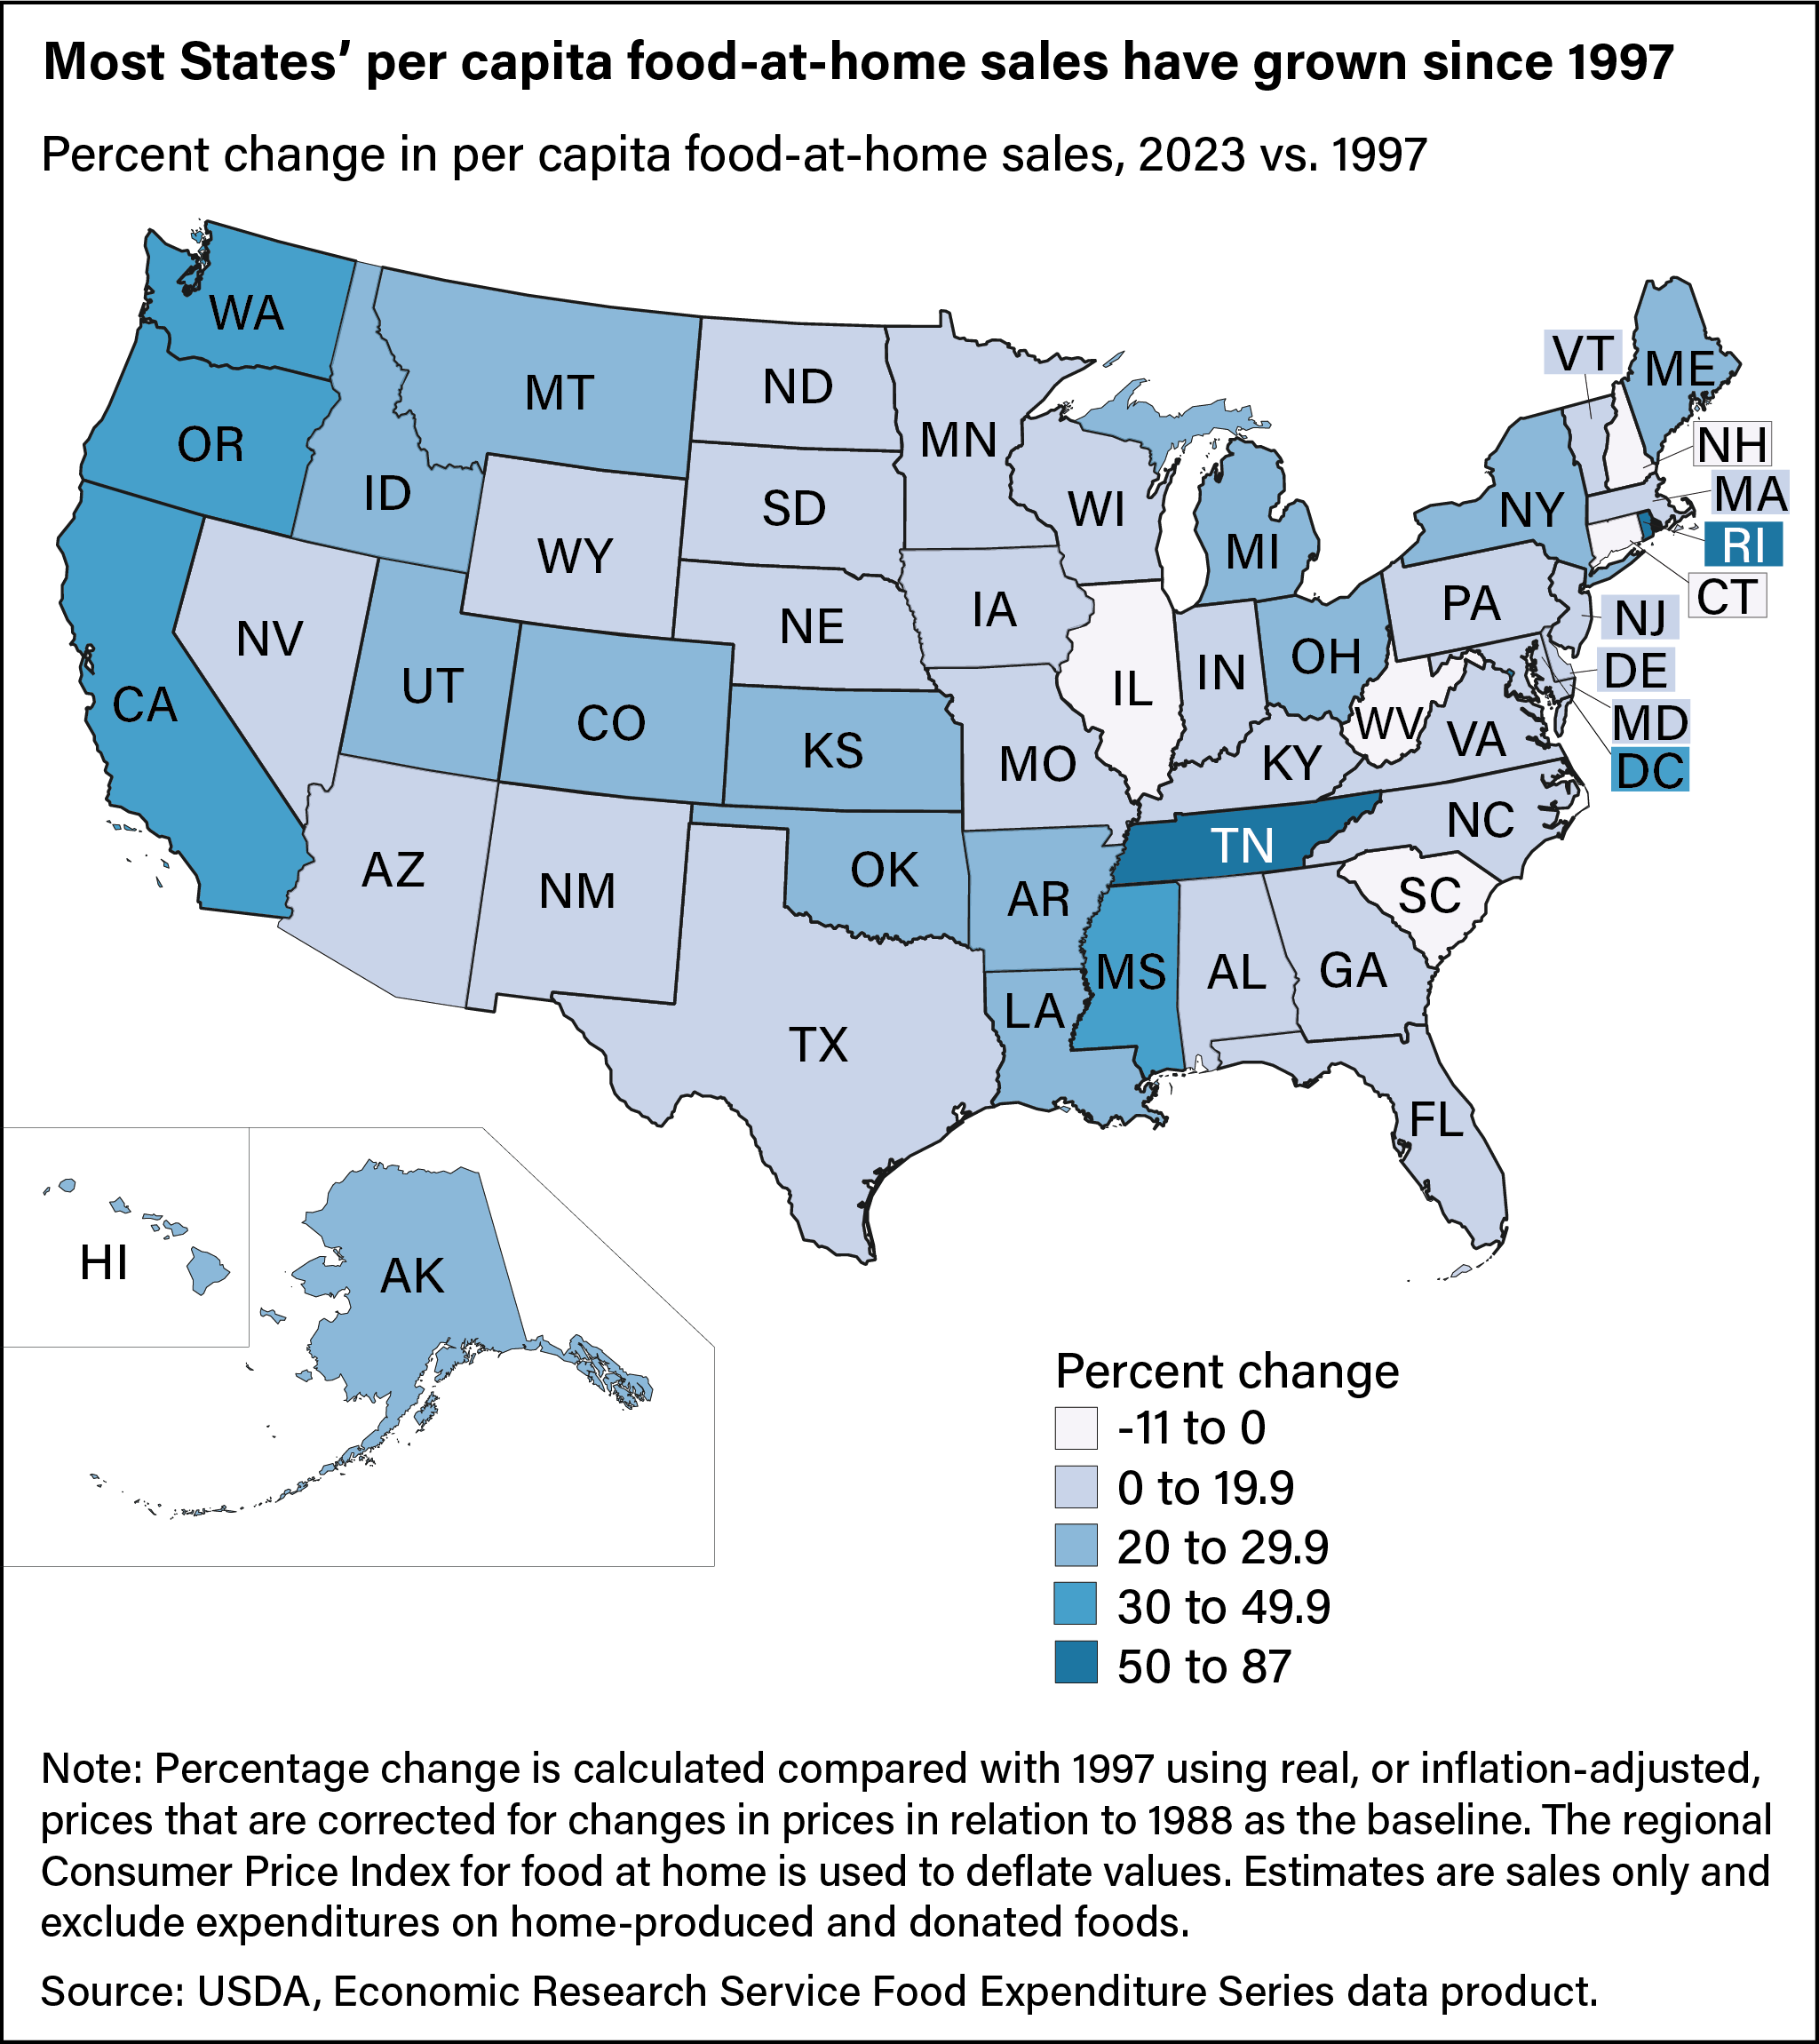
Most States’ per capita food-at-home sales have grown since 1997
- by Wilson Sinclair and Eliana Zeballos
- 6/6/2024

USDA, Economic Research Service (ERS) Food Expenditure Series analyzes sales of food prepared at home and food prepared and consumed away from home, allowing researchers to track consumer food purchasing behaviors. ERS recently revised the series’ State-level estimates.
