
Energy payments to farmers rise and fall with oil prices
- by Justin B. Winikoff and Karen Maguire
- 5/6/2024
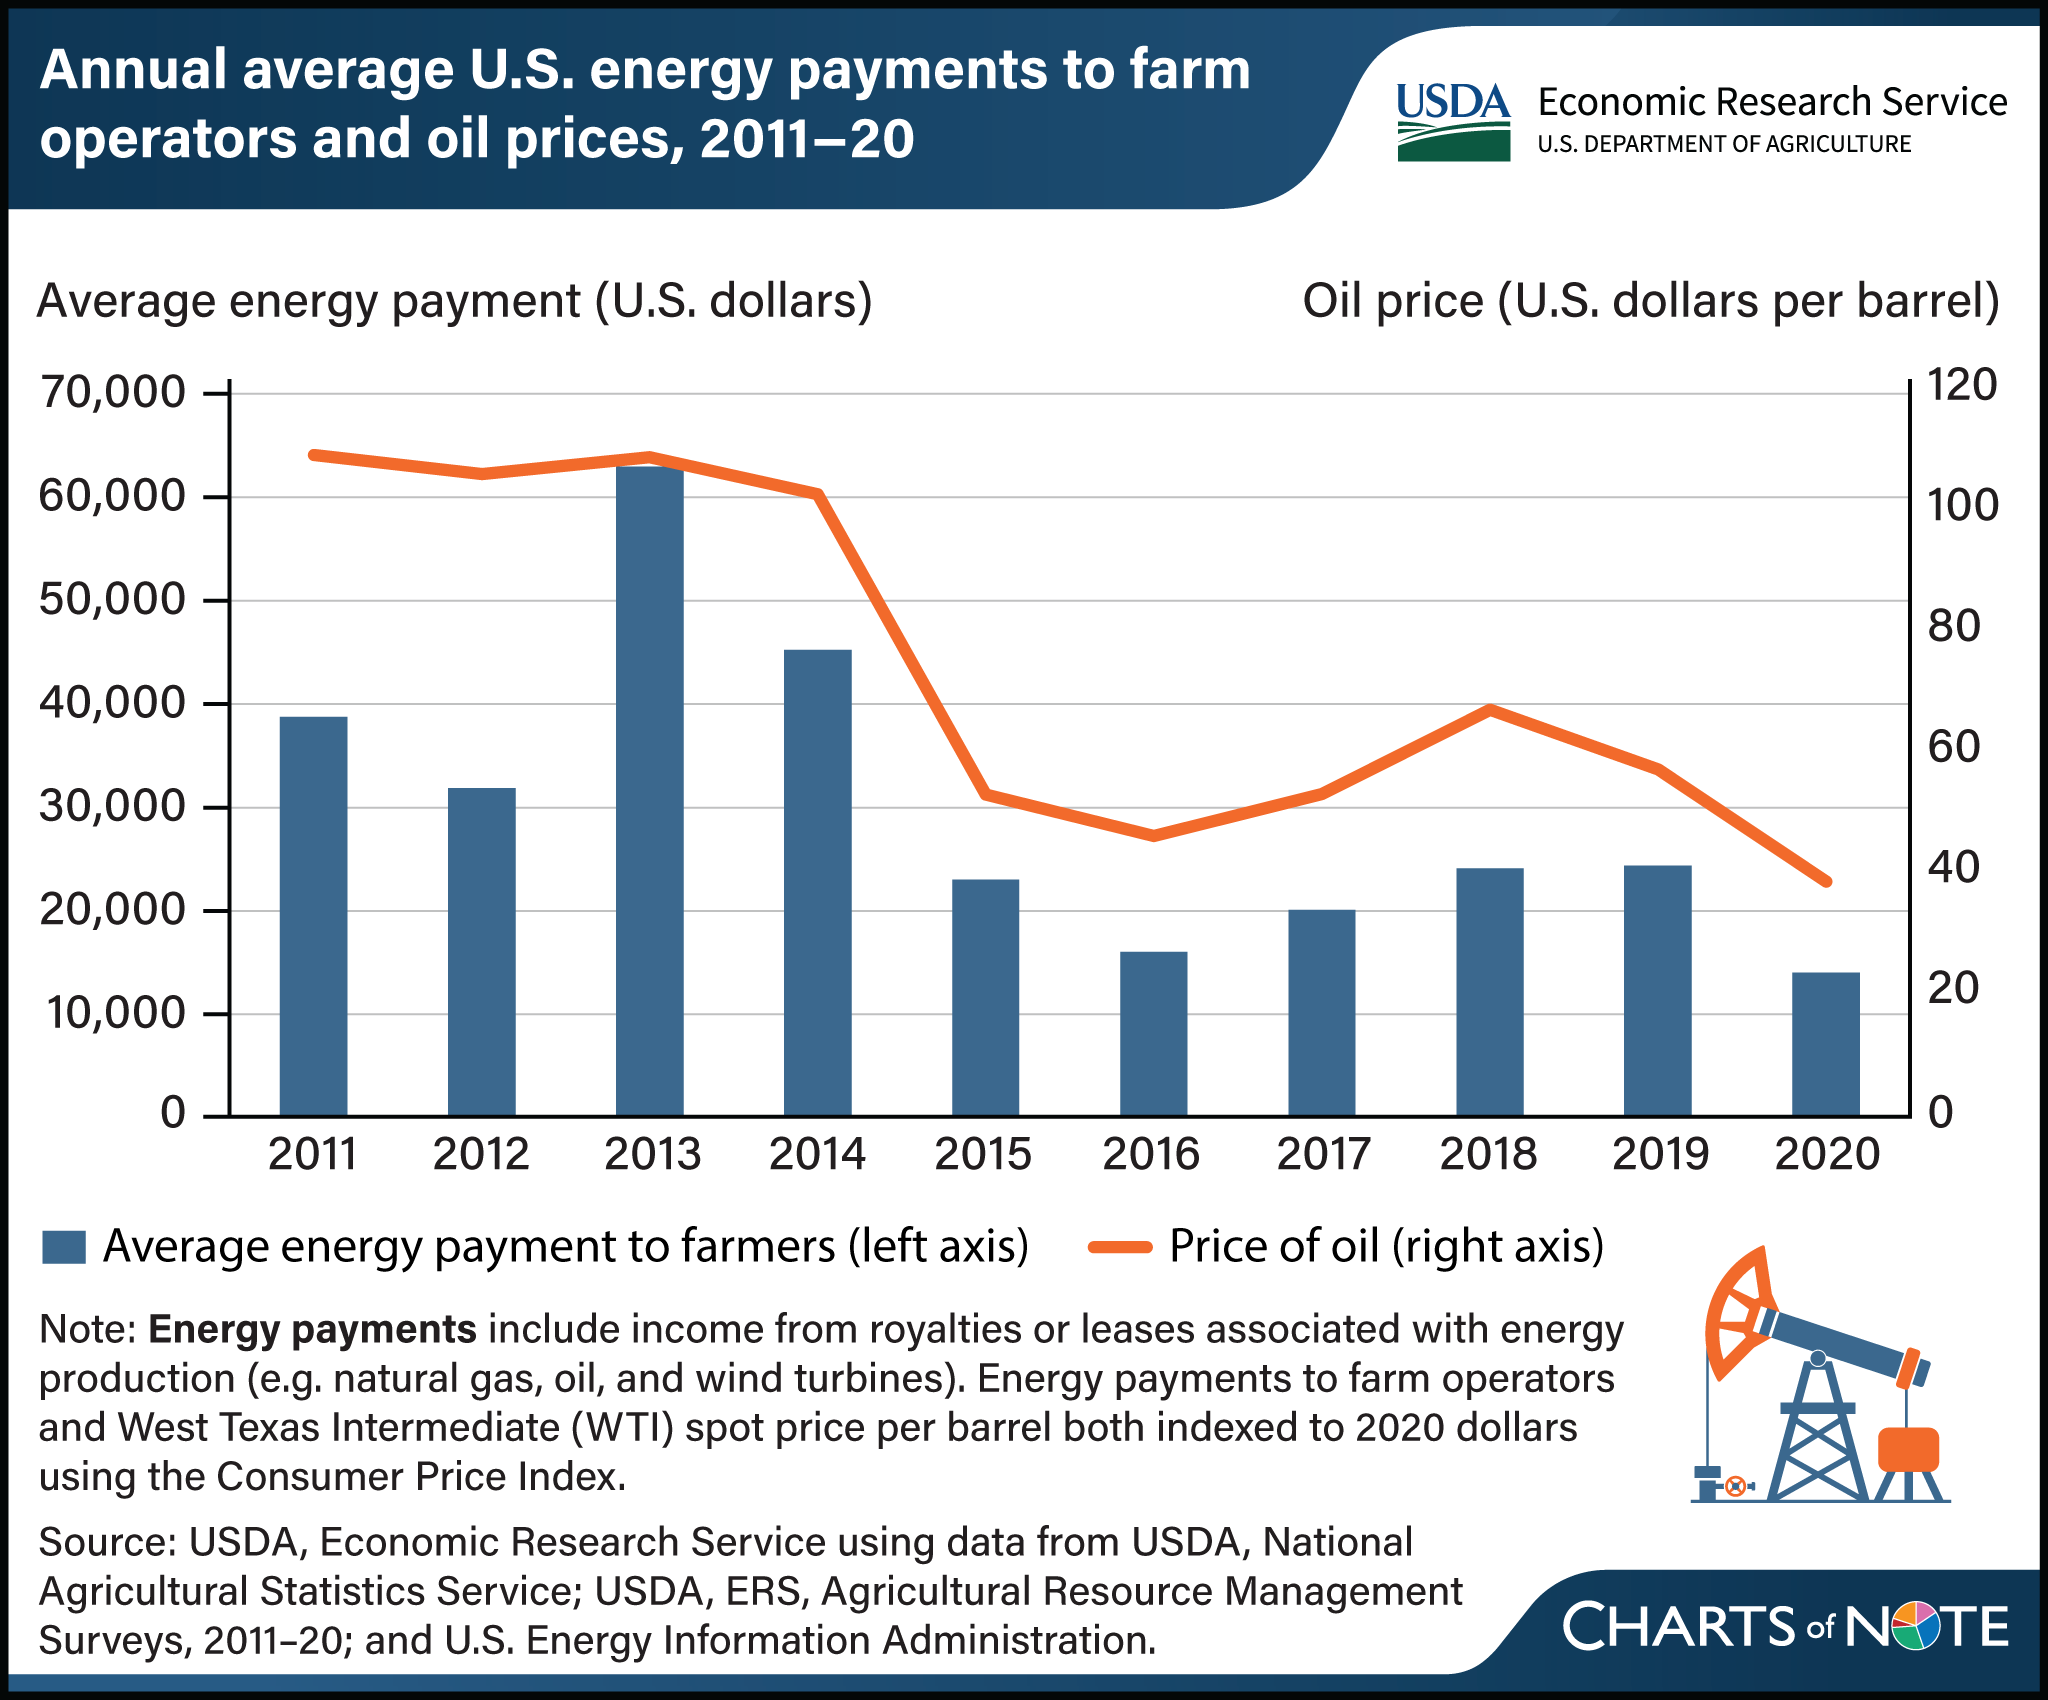
The amount of money farmers receive for leasing their land for the production of energy, such as oil, natural gas, or wind, varies significantly from year to year and has typically followed the price of oil. According to data analyzed by USDA, Economic Research Service (ERS) researchers, payments grew from an average of $38,788 in 2011 to $62,944 in 2013, when the price of oil averaged about $110 per barrel (adjusted for inflation), but then fell as low as $14,032 in 2020, when oil was near $40 per barrel. Not all farmers receive energy payments since many farm operators do not own their land, and even for those who do, subsurface mineral rights might have been separated from surface rights so that the farmer would not receive payments from on-farm energy production. For farmers who have historically benefited from energy, development of oil and natural gas have been a more common source of income than wind power, which is a younger industry. In the United States, about 3.5 percent of farm operations received energy payments between 2011 and 2020. Read more about the size, frequency, trends, and relative contribution of energy payments to farm operator income in the ERS report The Role of Commercial Energy Payments in Agricultural Producer Income, released in April 2024.