
ARC and PLC enrollment varies from one program year to the next
- by Dylan Turner
- 4/3/2024
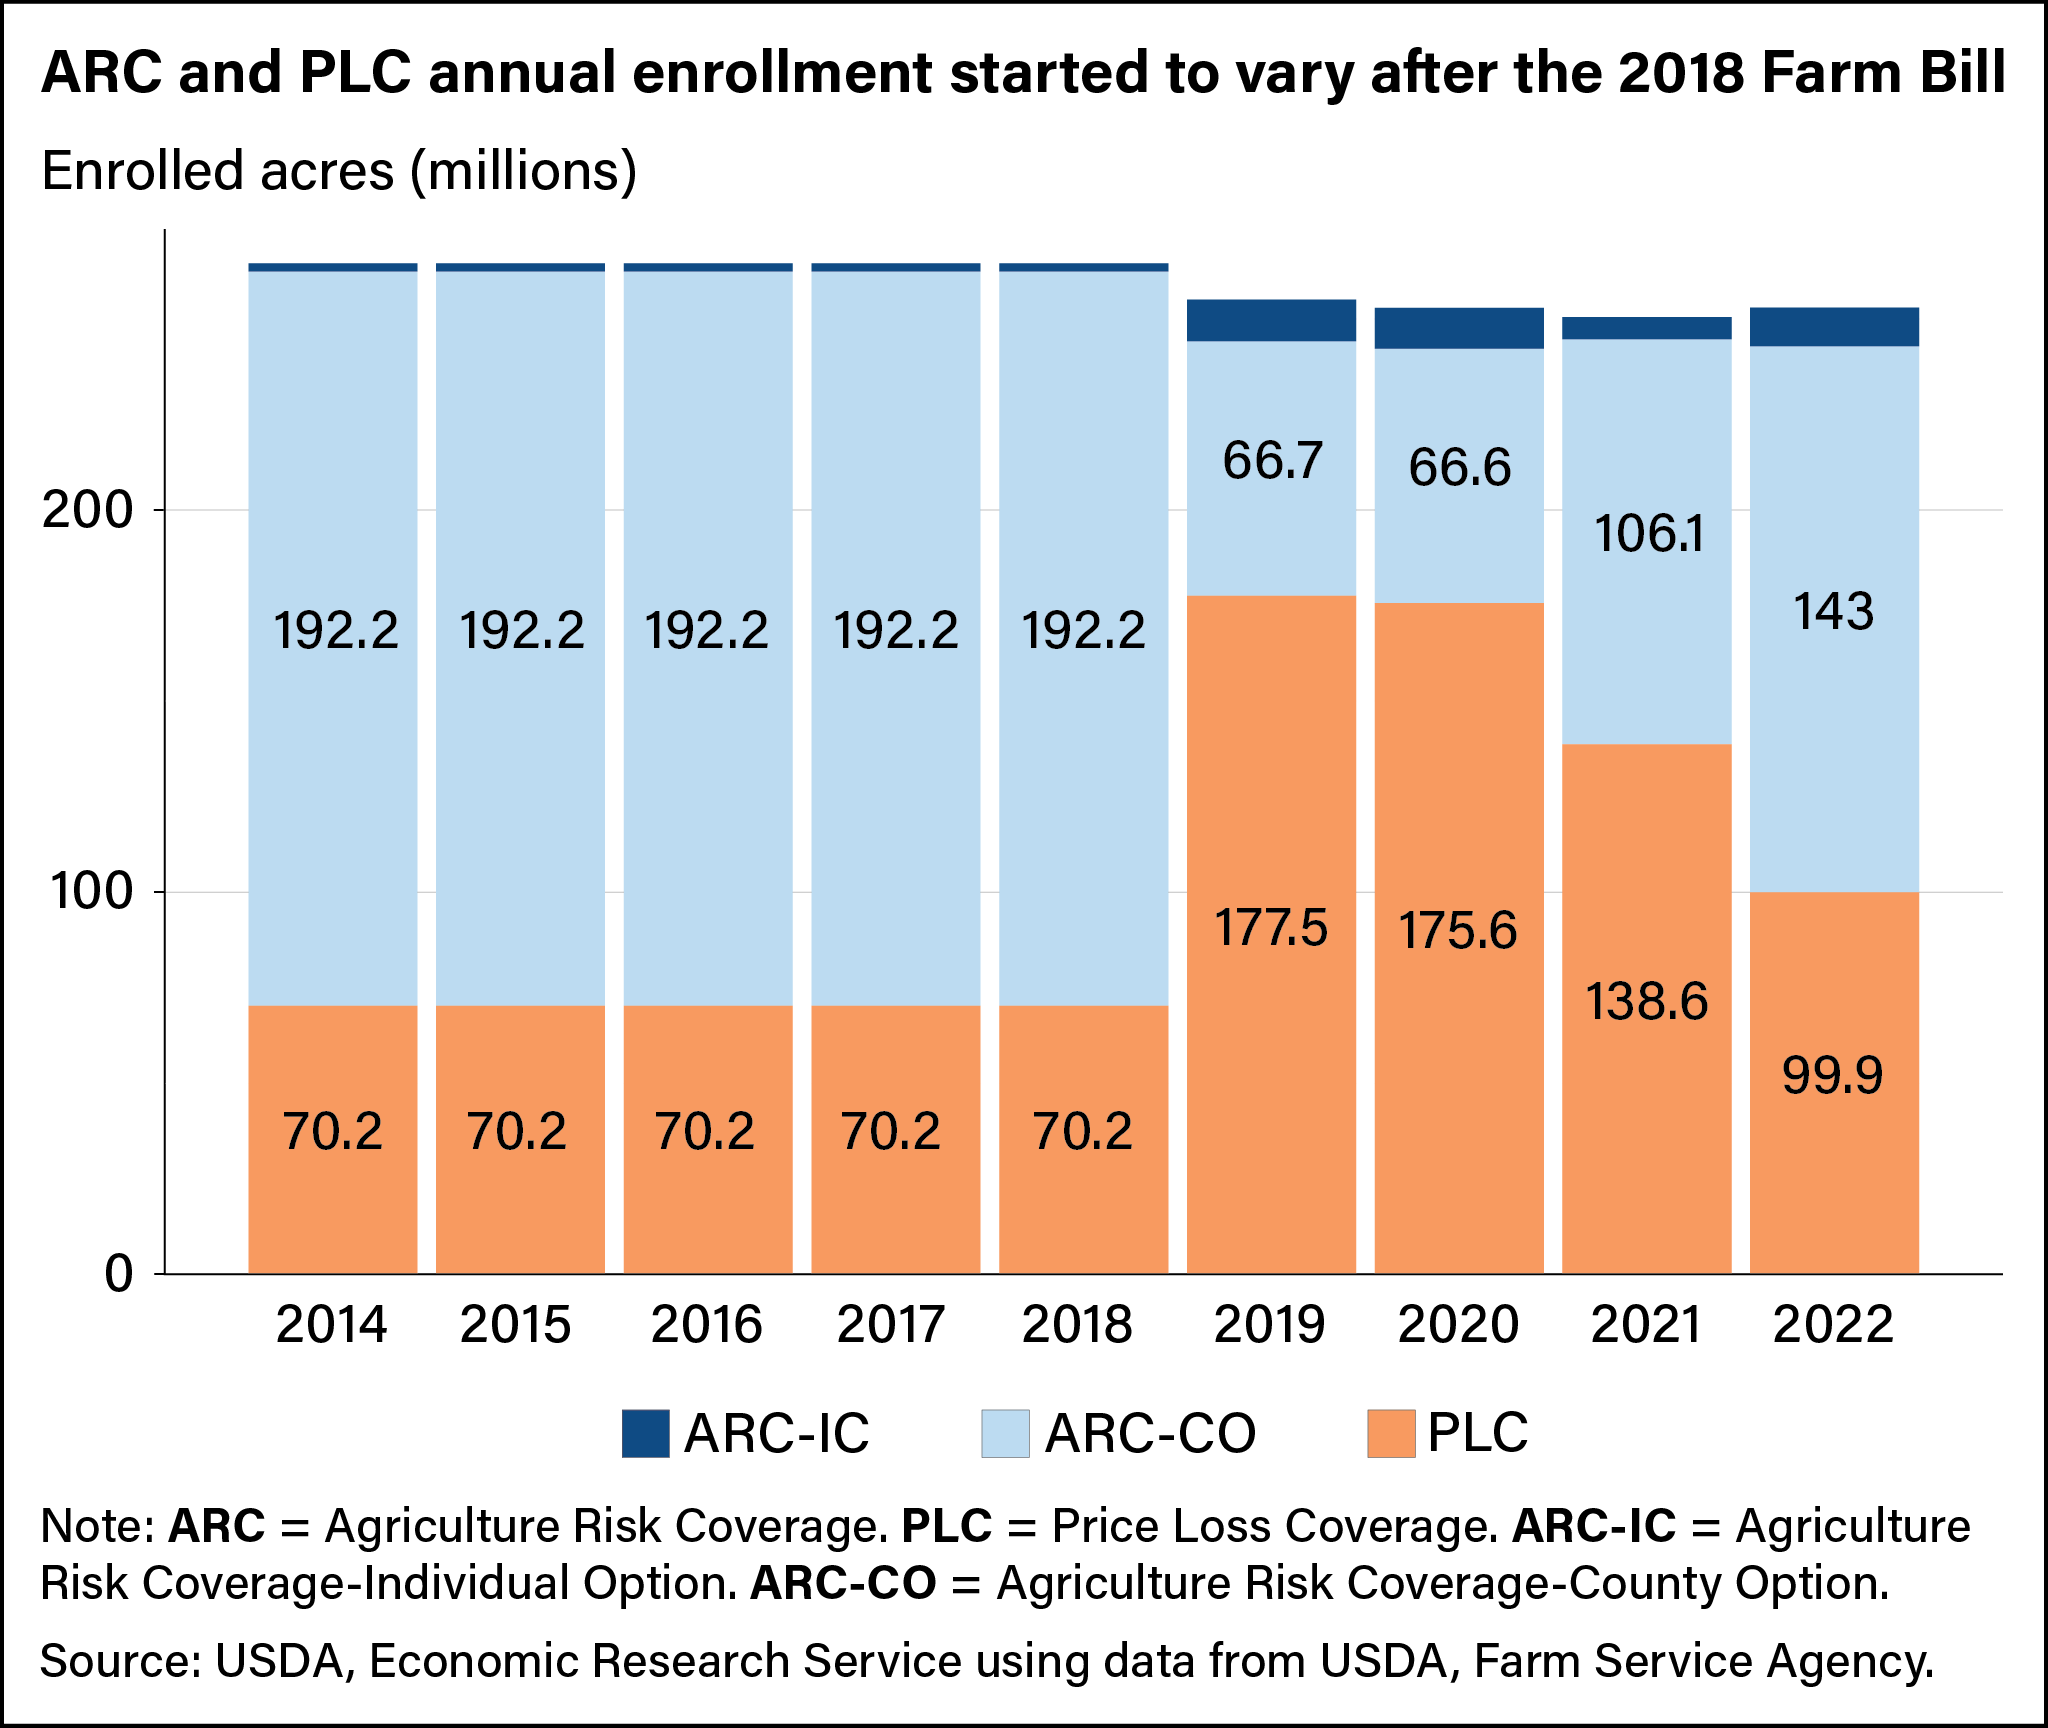
Participation and payouts in two USDA commodity support programs, Agriculture Risk Coverage and Price Loss Coverage, vary widely from year to year depending on market outcomes. The 2018 Farm Bill allowed farmers to change their program selection annually, adding to variability in participation and payouts.