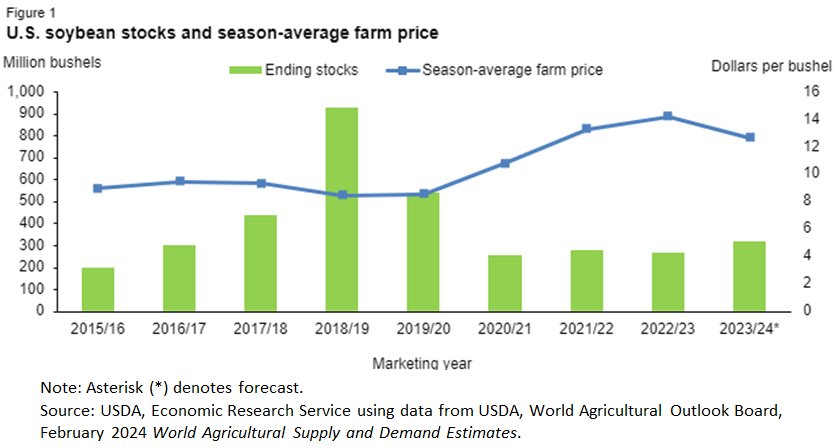
U.S. soybean stocks and season-average farm price
- by Maria Bukowski
- 2/12/2024
Official websites use .gov
A .gov website belongs to an official government organization in the United States.
Secure .gov websites use HTTPS
A lock (
) or https:// means you’ve safely connected to the .gov website. Share sensitive information only on official, secure websites.