
Highest percentages of limited resource farms are in Atlantic and West regions of United States
- by Jessica E. Todd, Nigel Key and Christine Whitt
- 2/2/2024
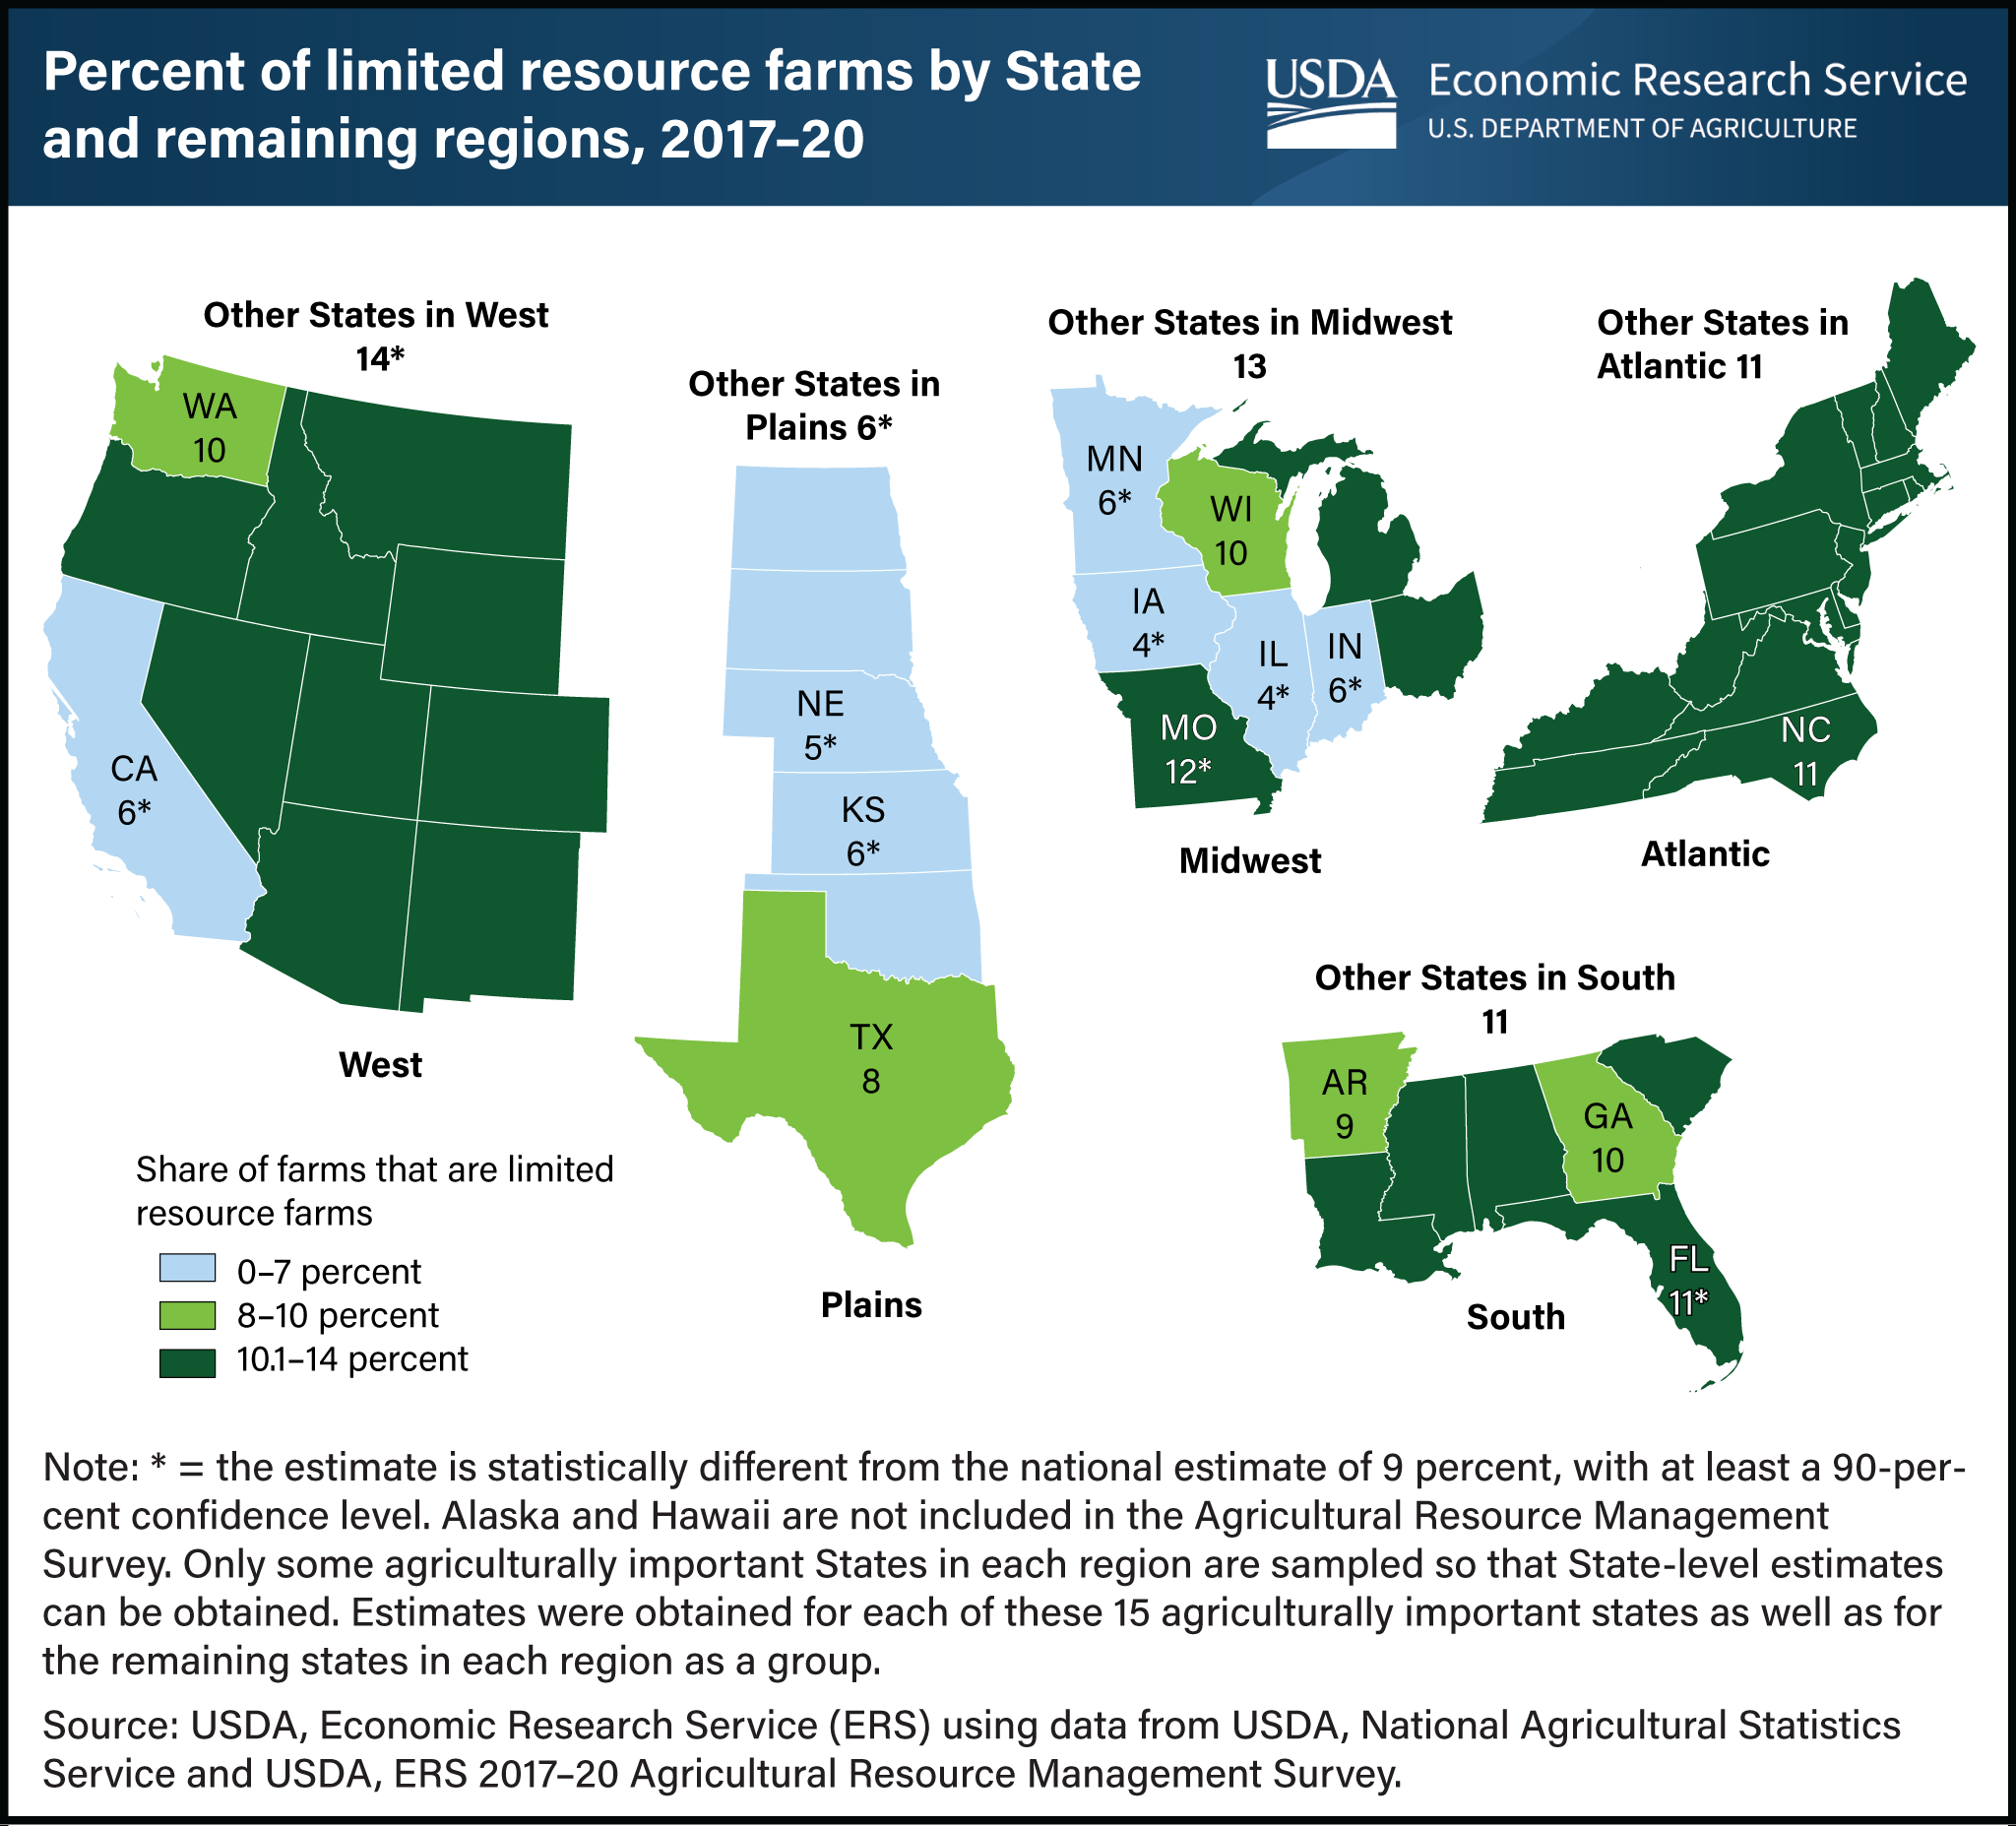
USDA identifies farmers and ranchers as limited resource (LR) producers as those who, for two consecutive years, operate a farm with gross farm sales less than $180,300 (in 2020 dollars) and have total household income either below the Federal poverty level for a family of four or less than half of the median household income in the county where they live. Between 2017 and 2020, 9.3 percent of all U.S. farms had an LR principal operator, according to the Agricultural Resource Management Survey (ARMS). Of the remaining farms, 76.3 percent had farm sales low enough to meet LR status, but did not meet other requirements, while 14.3 percent had gross farm sales above the LR threshold. The ARMS data also reveal that the share of farms that were LR varied geographically, with lower proportions in the Plains region and higher proportions in the Atlantic and West regions. There were also within-region differences in the share of farms that were LR farms, such as the Midwest, where 4 percent of farms in Iowa and Illinois were LR while Missouri had roughly 12 percent. This highlights differences in the scale of production, as well as differences in off-farm income and county median incomes. ARMS is the only nationally representative survey that collects the information needed to determine whether the principal operator on a farm meets the LR criteria. This chart is found in the USDA, Economic Research Service’s report An Overview of Farms Operated by Socially Disadvantaged, Women, and Limited Resource Farmers and Ranchers in the United States, published in February 2024.