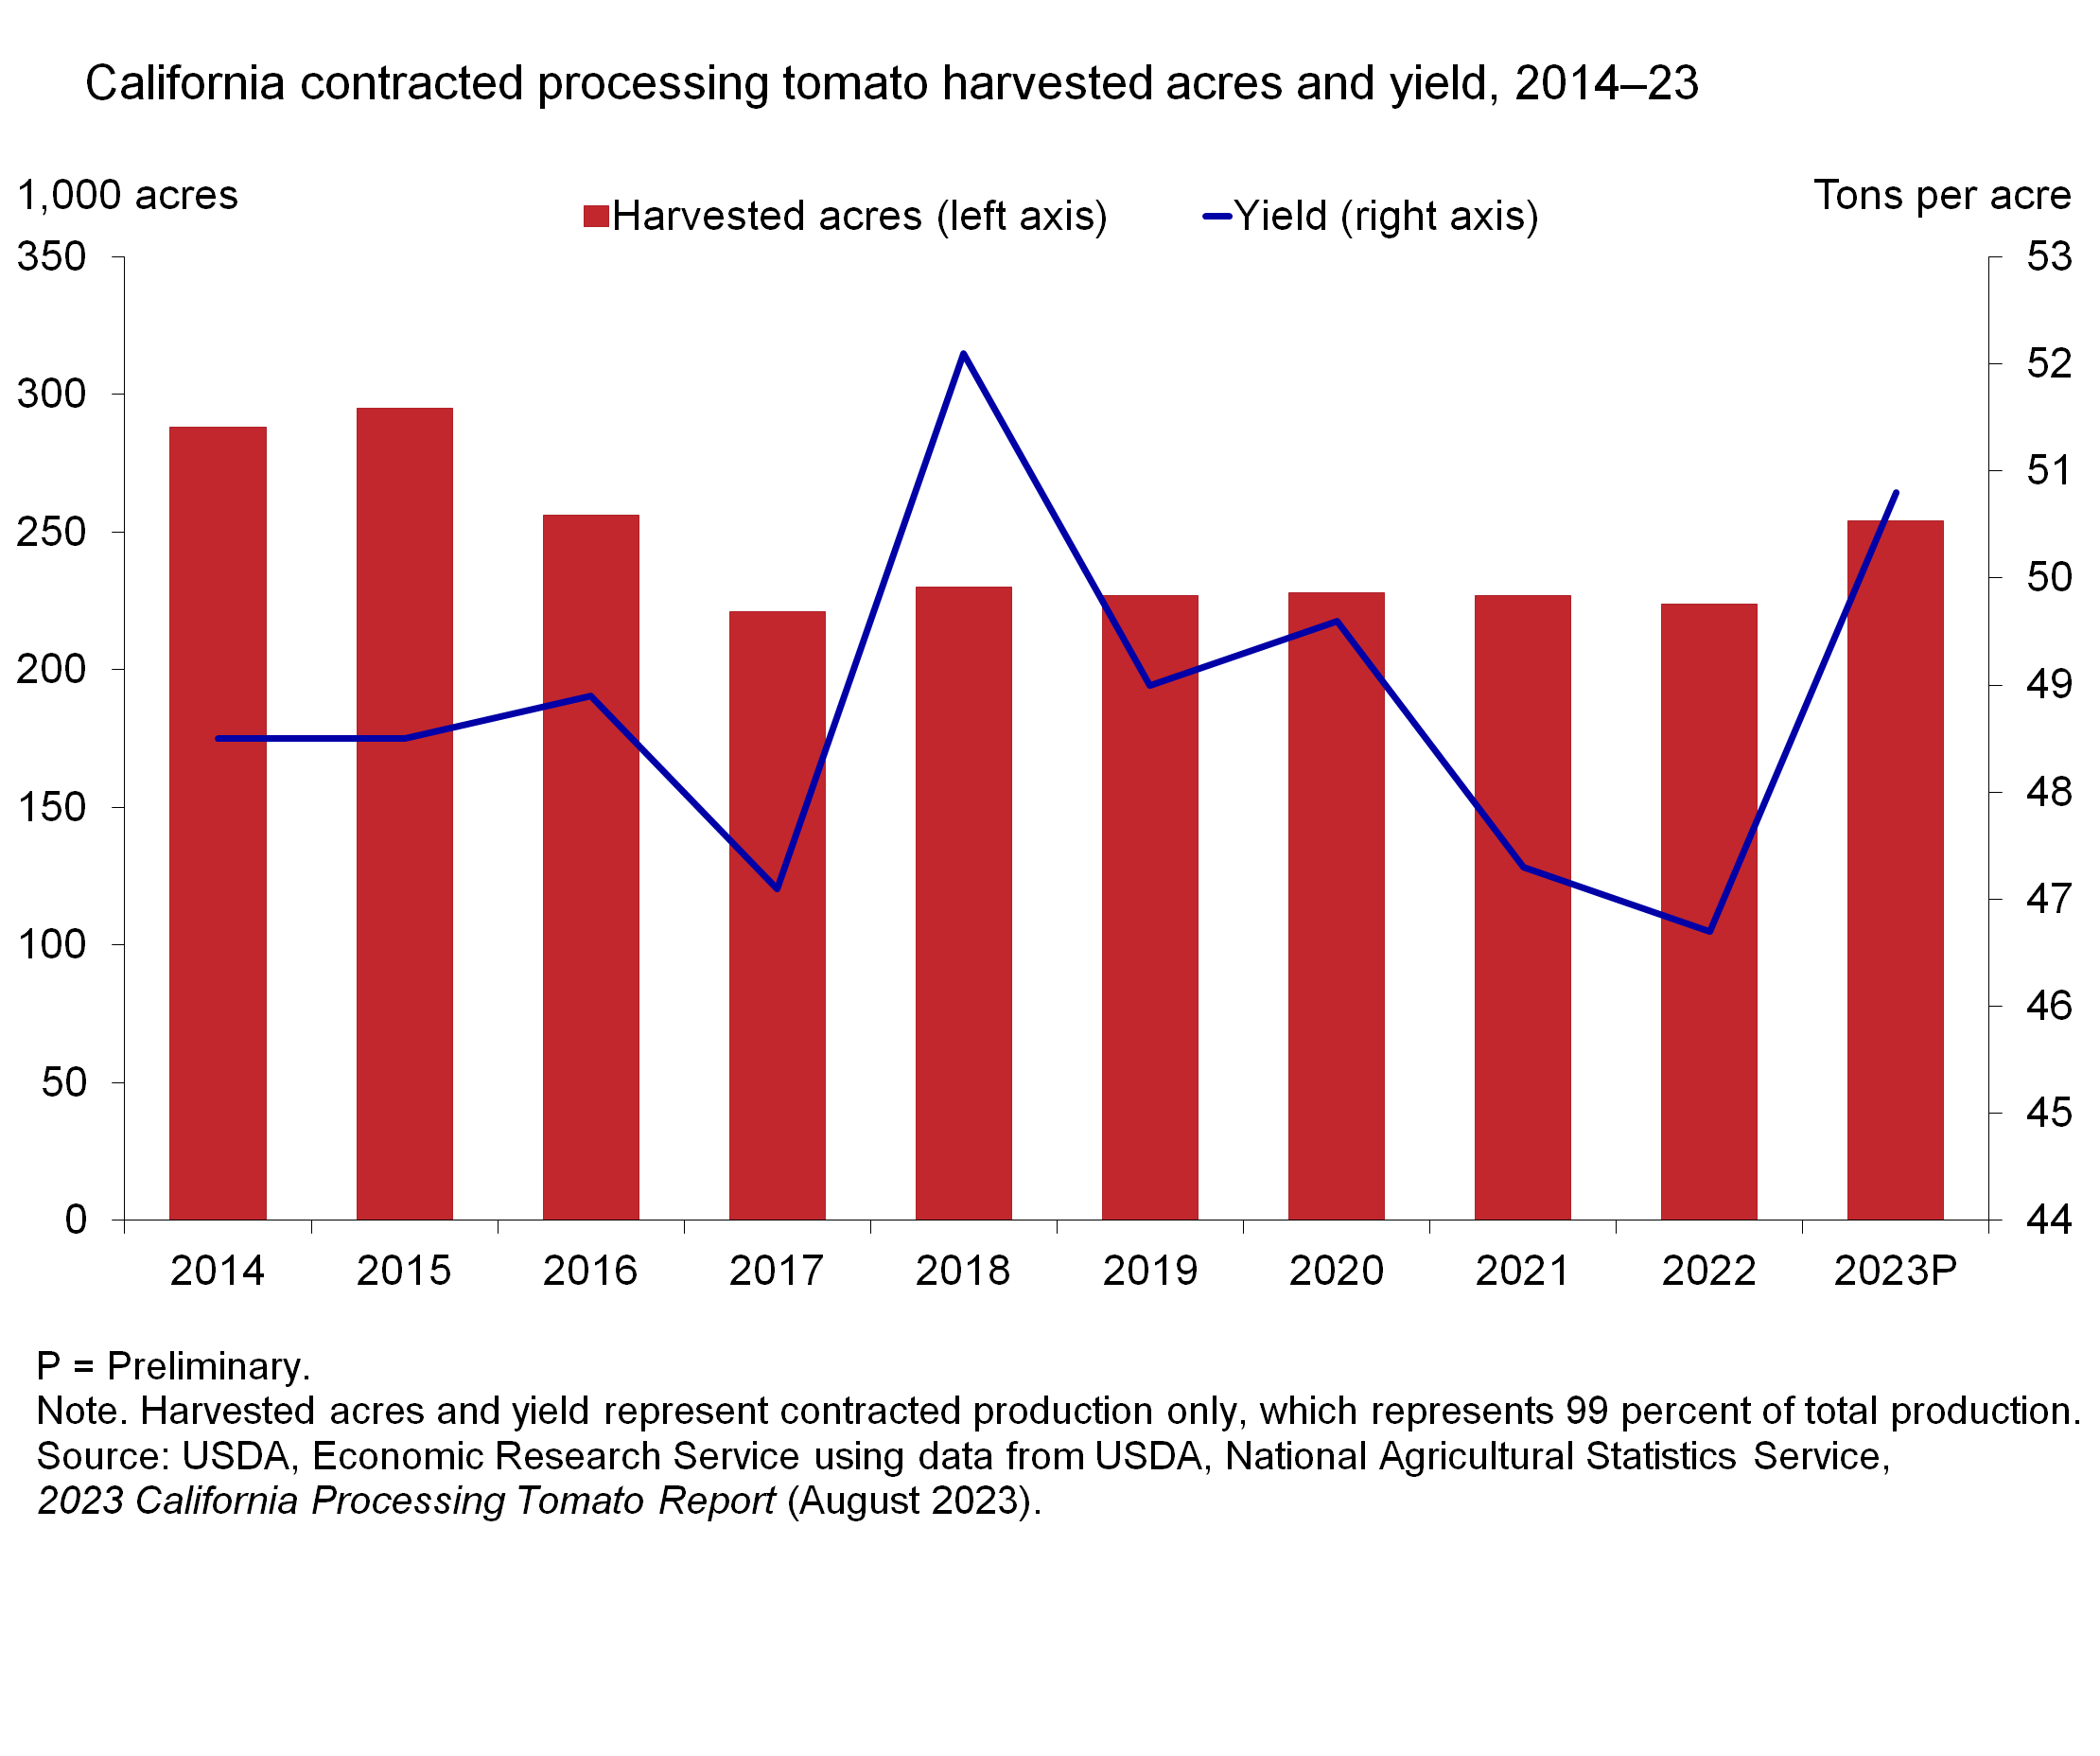
California contracted processing tomato harvested acres and yield, 2014–23
- by Wilma V. Davis, Catharine Weber, Seth J. Wechsler and Helen Wakefield
- 12/14/2023
Official websites use .gov
A .gov website belongs to an official government organization in the United States.
Secure .gov websites use HTTPS
A lock (
) or https:// means you’ve safely connected to the .gov website. Share sensitive information only on official, secure websites.