
Number of counties in persistent poverty falls from a decade ago
- by Tracey Farrigan and Austin Sanders
- 12/13/2023
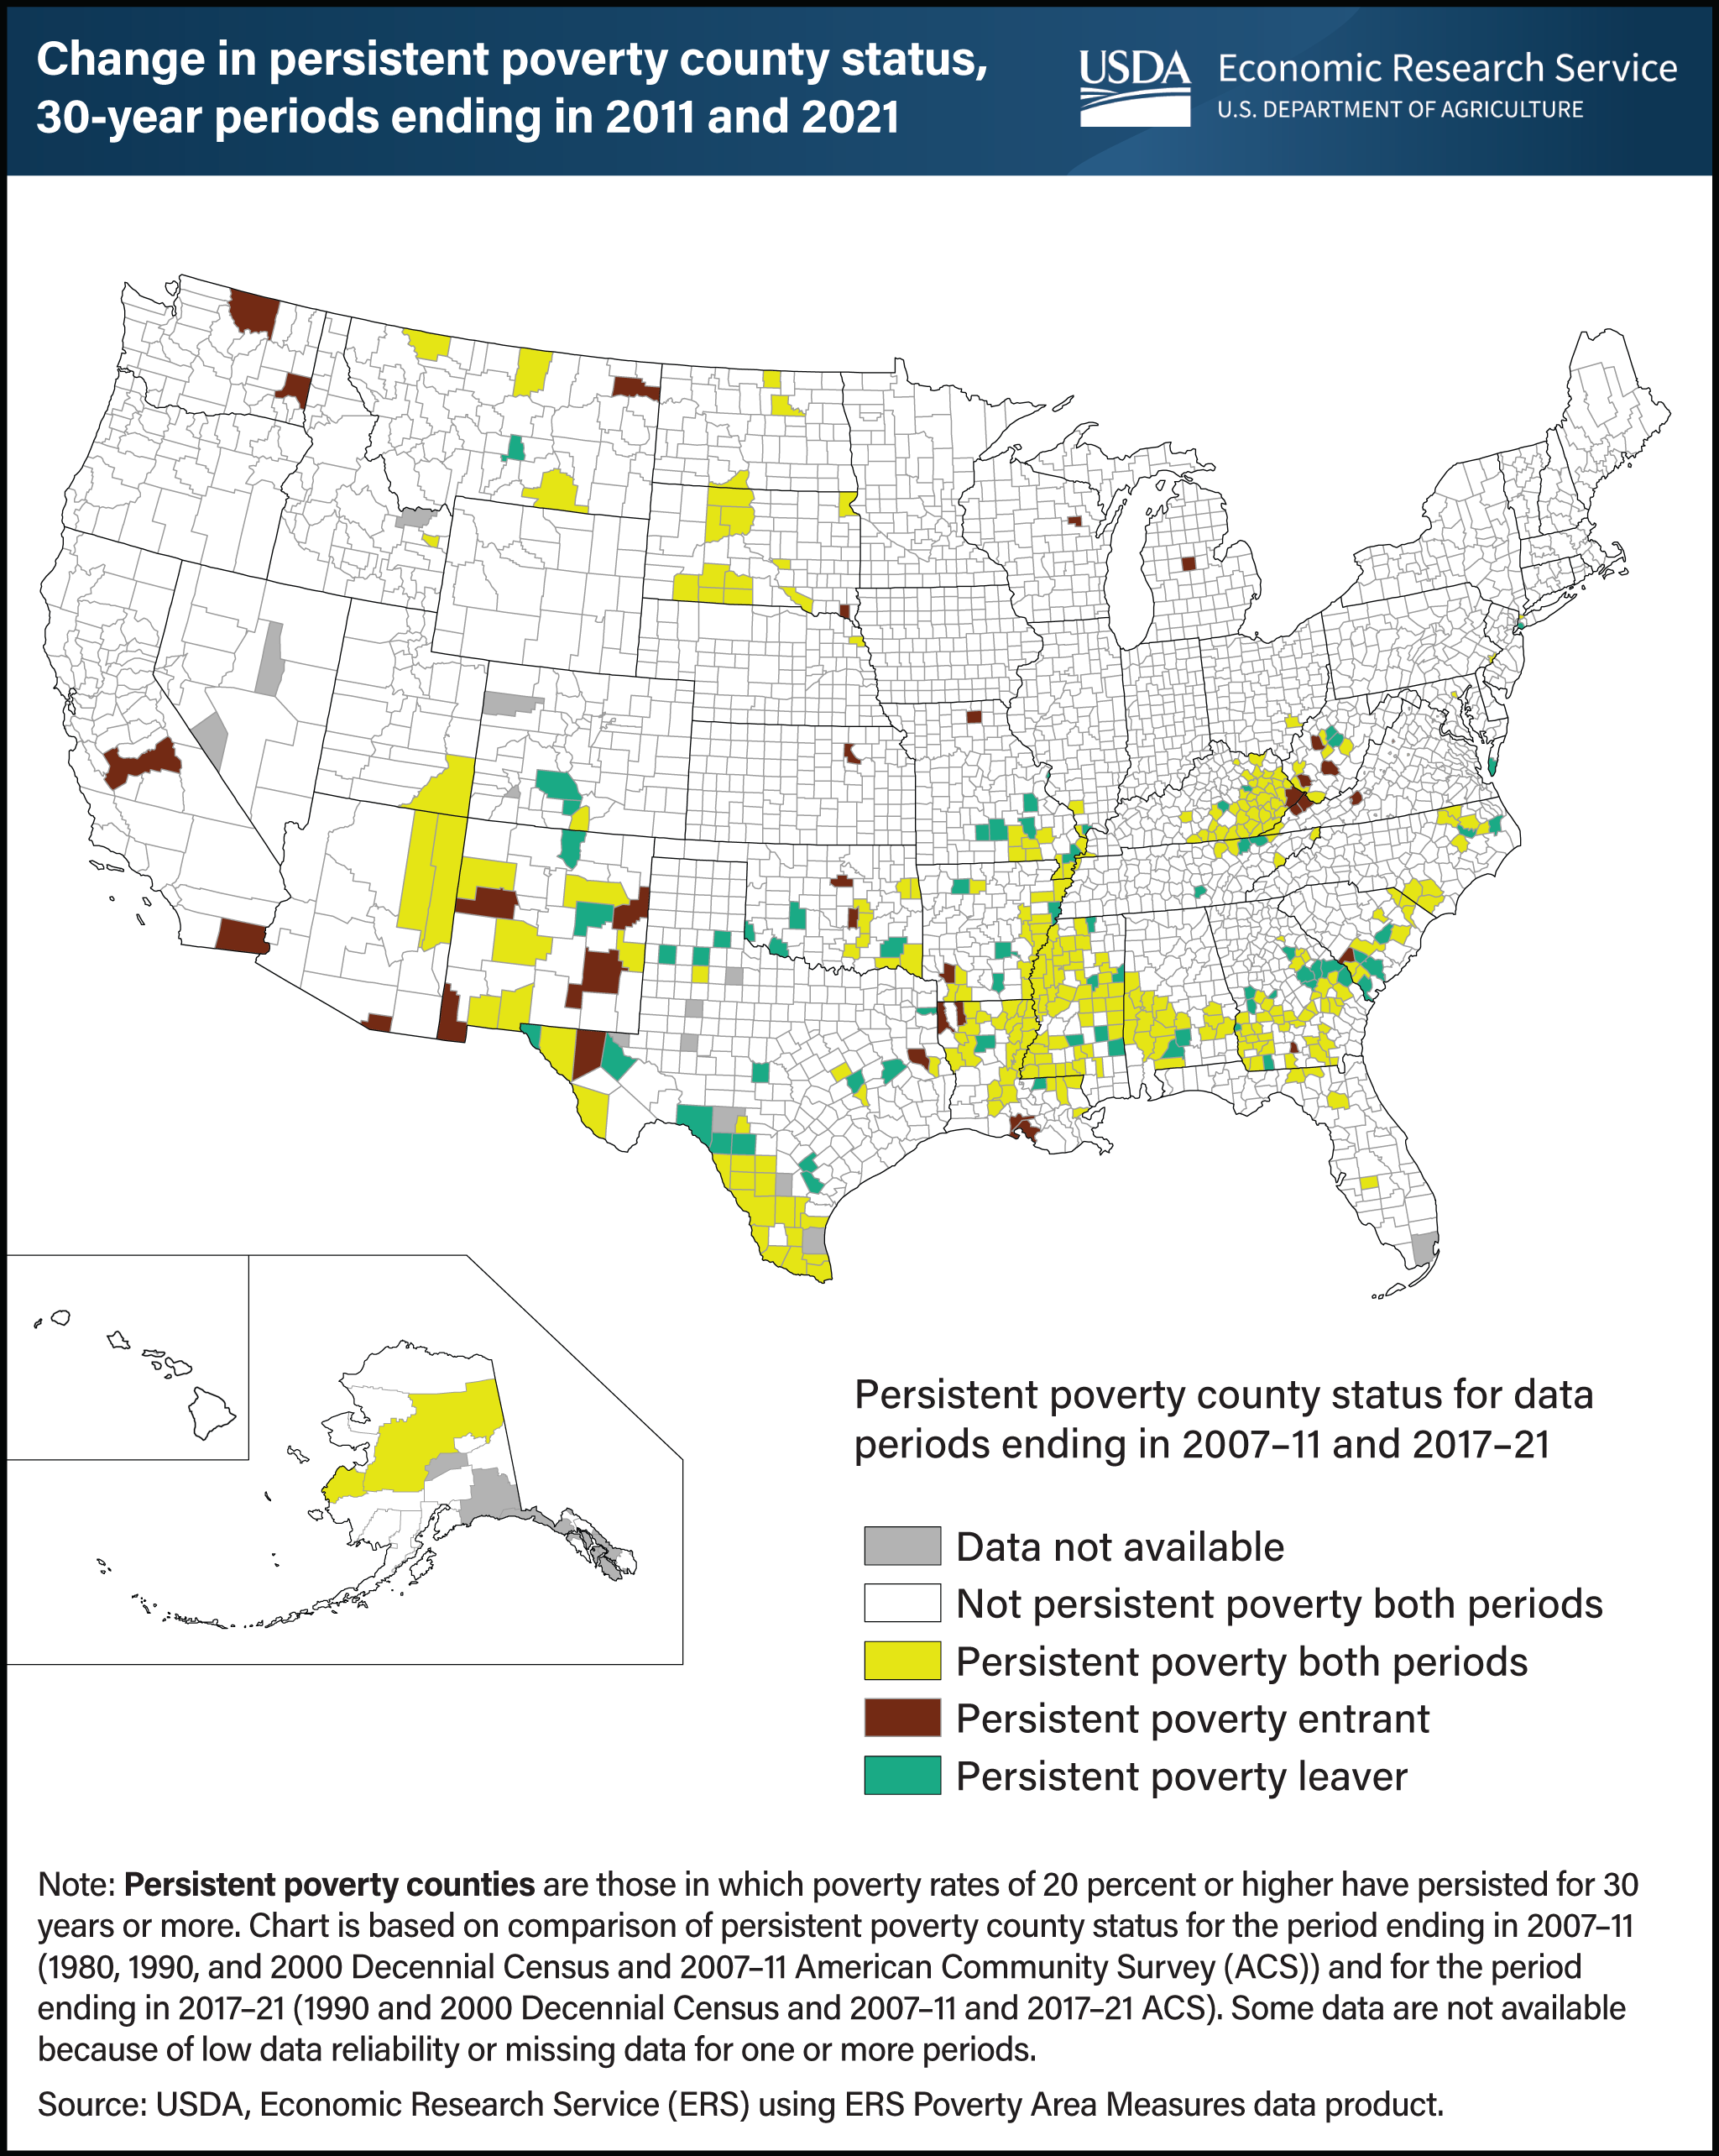
The number of counties classified as persistently poor has fallen over the last 10 years. Persistent poverty counties are those in which poverty rates of 20 percent or higher have persisted for 30 years or more. The USDA, Economic Research Service (ERS) has published poverty county classifications since the 1980s (using data from as early as the 1950s), which allow for the evaluation of changes in county poverty status over time. The most current persistent poverty classification covers the period from 1990 to 2021. ERS researchers examined changes between this classification and one from a decade earlier (data from 1980 to 2011). There were 318 persistent poverty counties in the 30-year period ending in 2021 compared with 353 for the period ending in 2011, a drop of 10 percent. Overall, 282 counties remained persistently poor from one period to the next, 36 counties entered persistent poverty status, and 70 left that category. The entrants are largely characterized by poverty among the resident Hispanic population, as well as re-entrants within historically poor areas such as central Appalachia. The counties that left persistent poverty status were predominantly in the Southern Coastal Plains, which includes much of the historically poor region known as the Black Belt. This chart uses data found in the ERS Poverty Area Measures data product, updated in December 2023.