
Food services continue to claim largest share of U.S. food dollars
- by James Chandler Zachary and Quinton Baker
- 12/6/2023
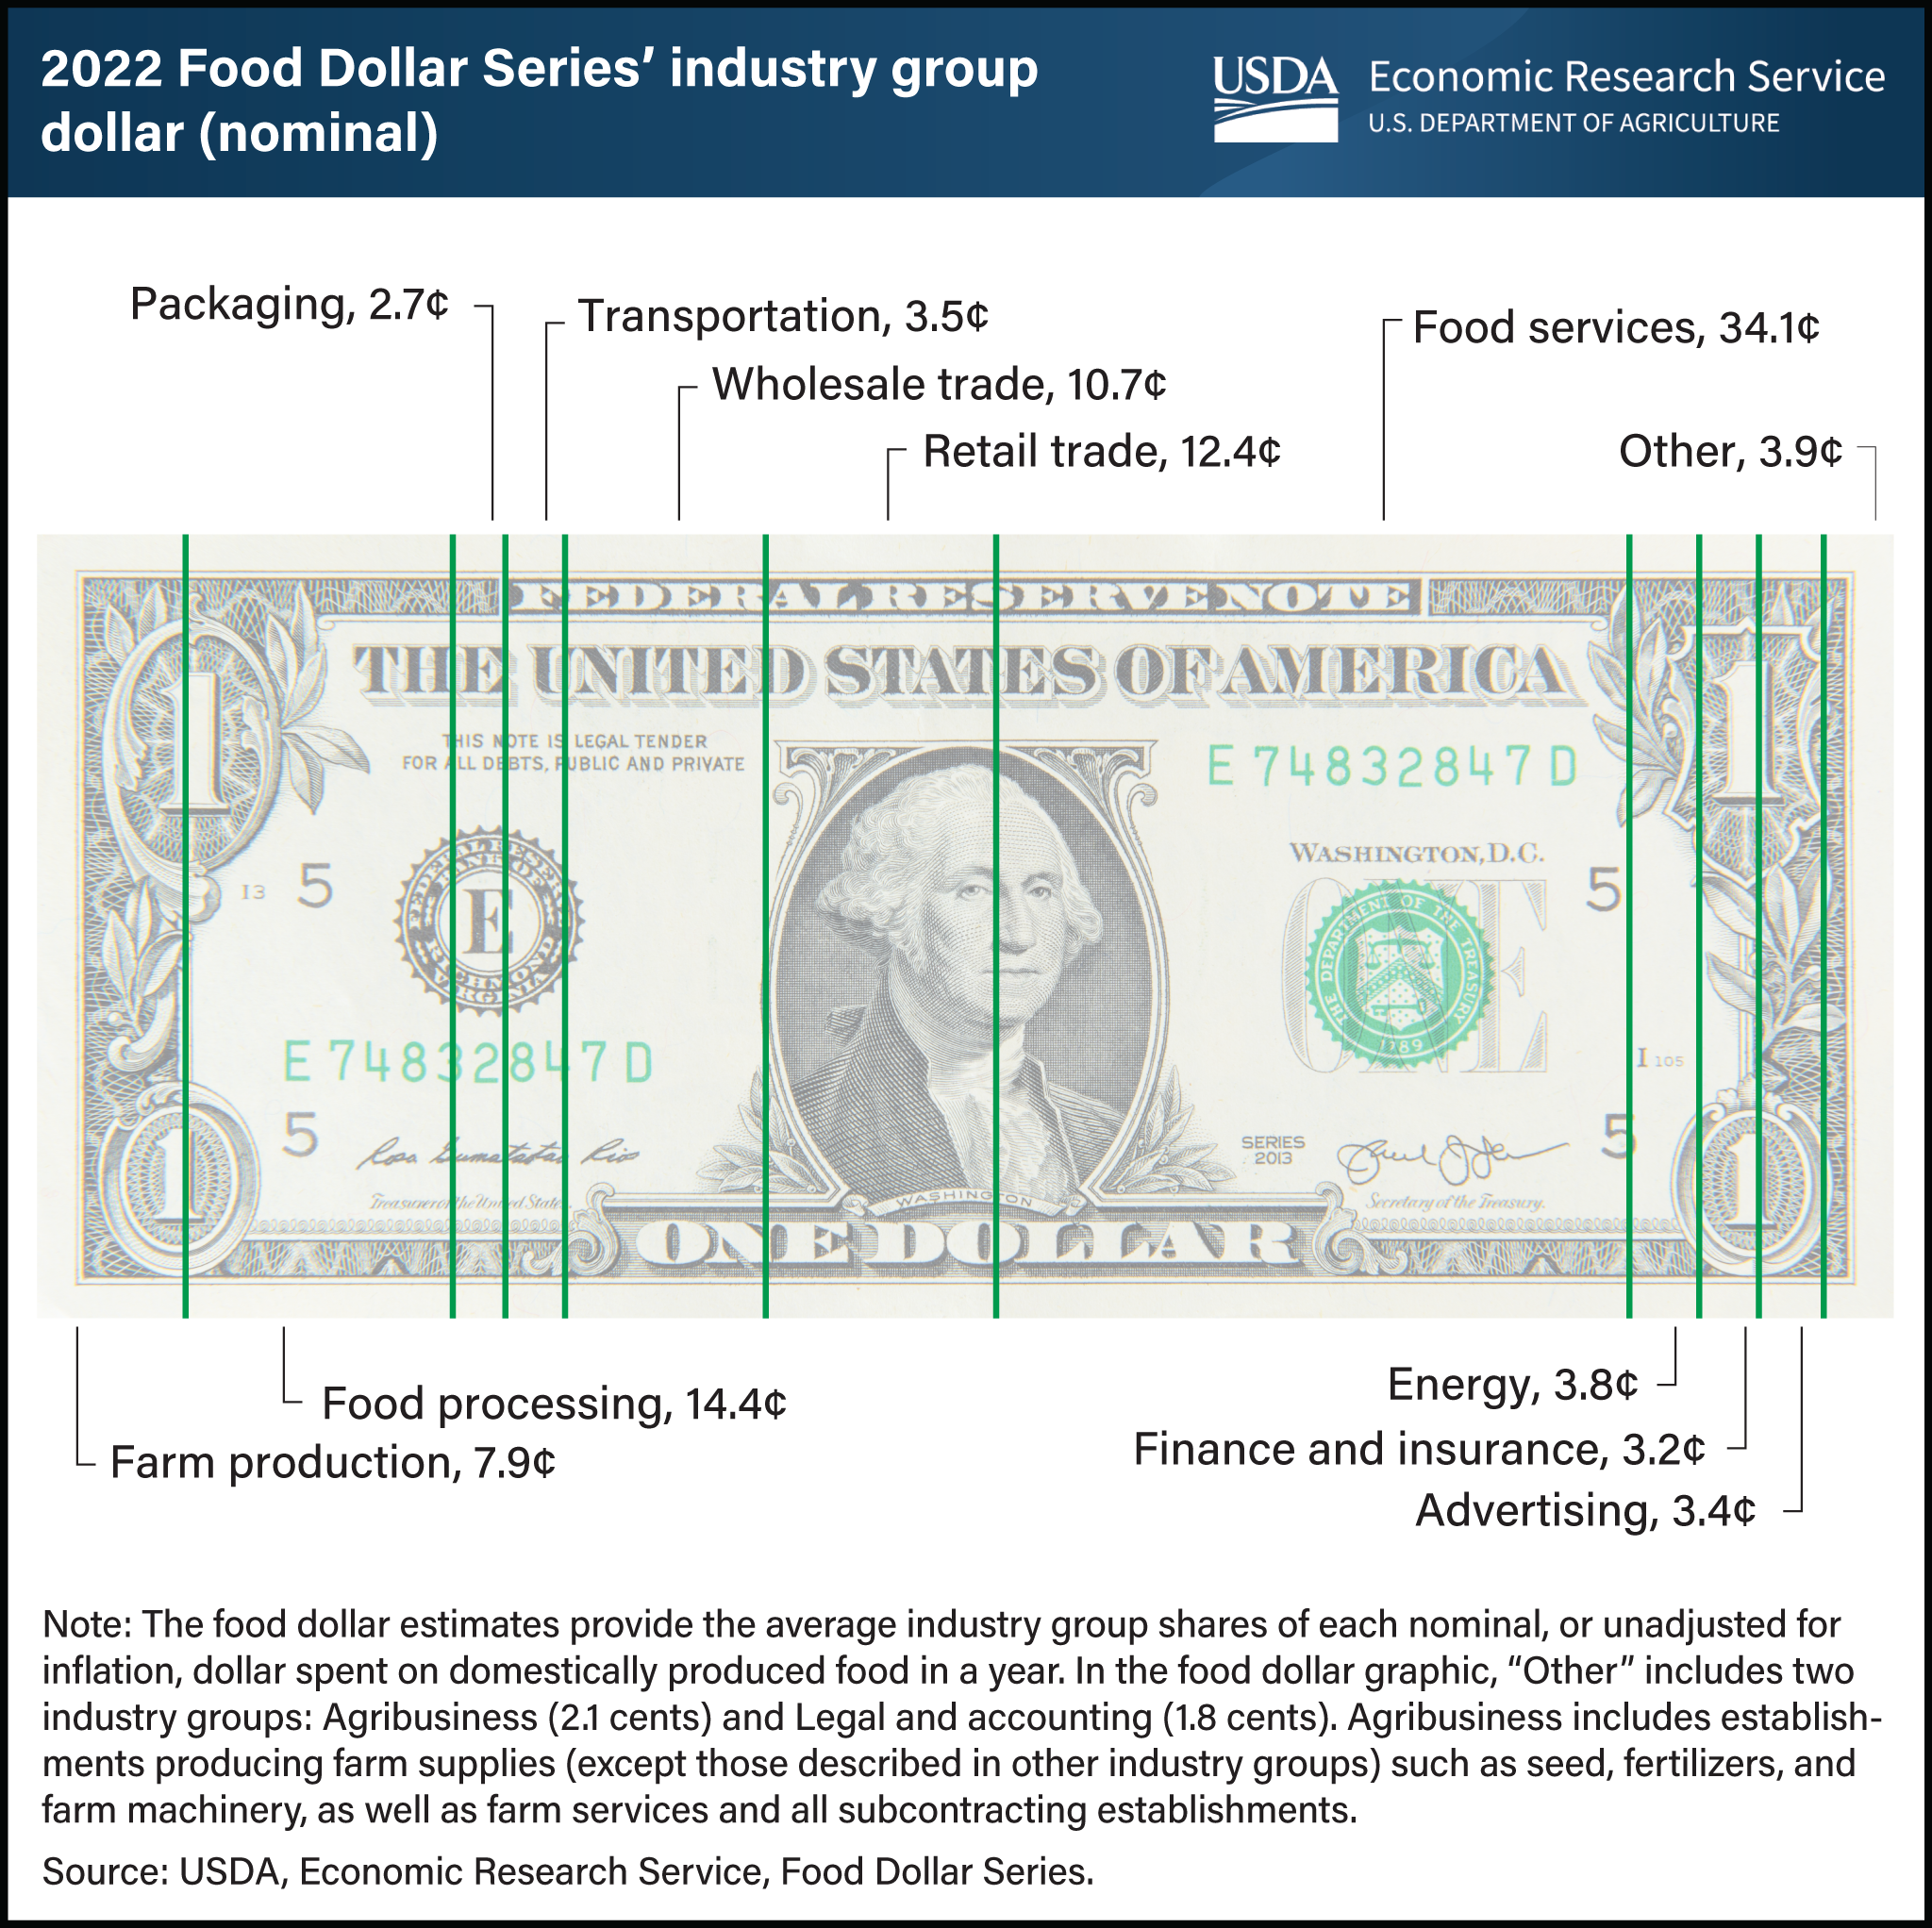
In 2022, more than a third of U.S. dollars spent on domestically produced food went to foodservice establishments, which includes restaurants and other food-away-from-home outlets. At 34.1 cents per food dollar in 2022, the foodservice share increased 1.6 cents from 2021 to reach its highest value in the USDA, Economic Research Service’s (ERS) Food Dollar Series. Industry groups add value by transforming the inputs they purchase from other industry groups and selling their output at higher prices. For instance, foodservice establishments prepare meals using food bought from distributors, such as those in the wholesale trade industry group, and utilities, such as gas and electricity bought from establishments in the energy industry group. Prices paid by customers include the value added by the restaurant itself plus the cumulative value added by all establishments before the restaurant. Annual shifts in the food dollar shares among industry groups occur for a variety of reasons, including changes in the mix of foods consumers buy, costs of materials, ingredients, and other inputs, as well as changes in the balance of food at home and away from home. The industry group shares food dollar data are available for 1993 to 2022 in the USDA, ERS Food Dollar Series data product, updated November 15, 2023.