
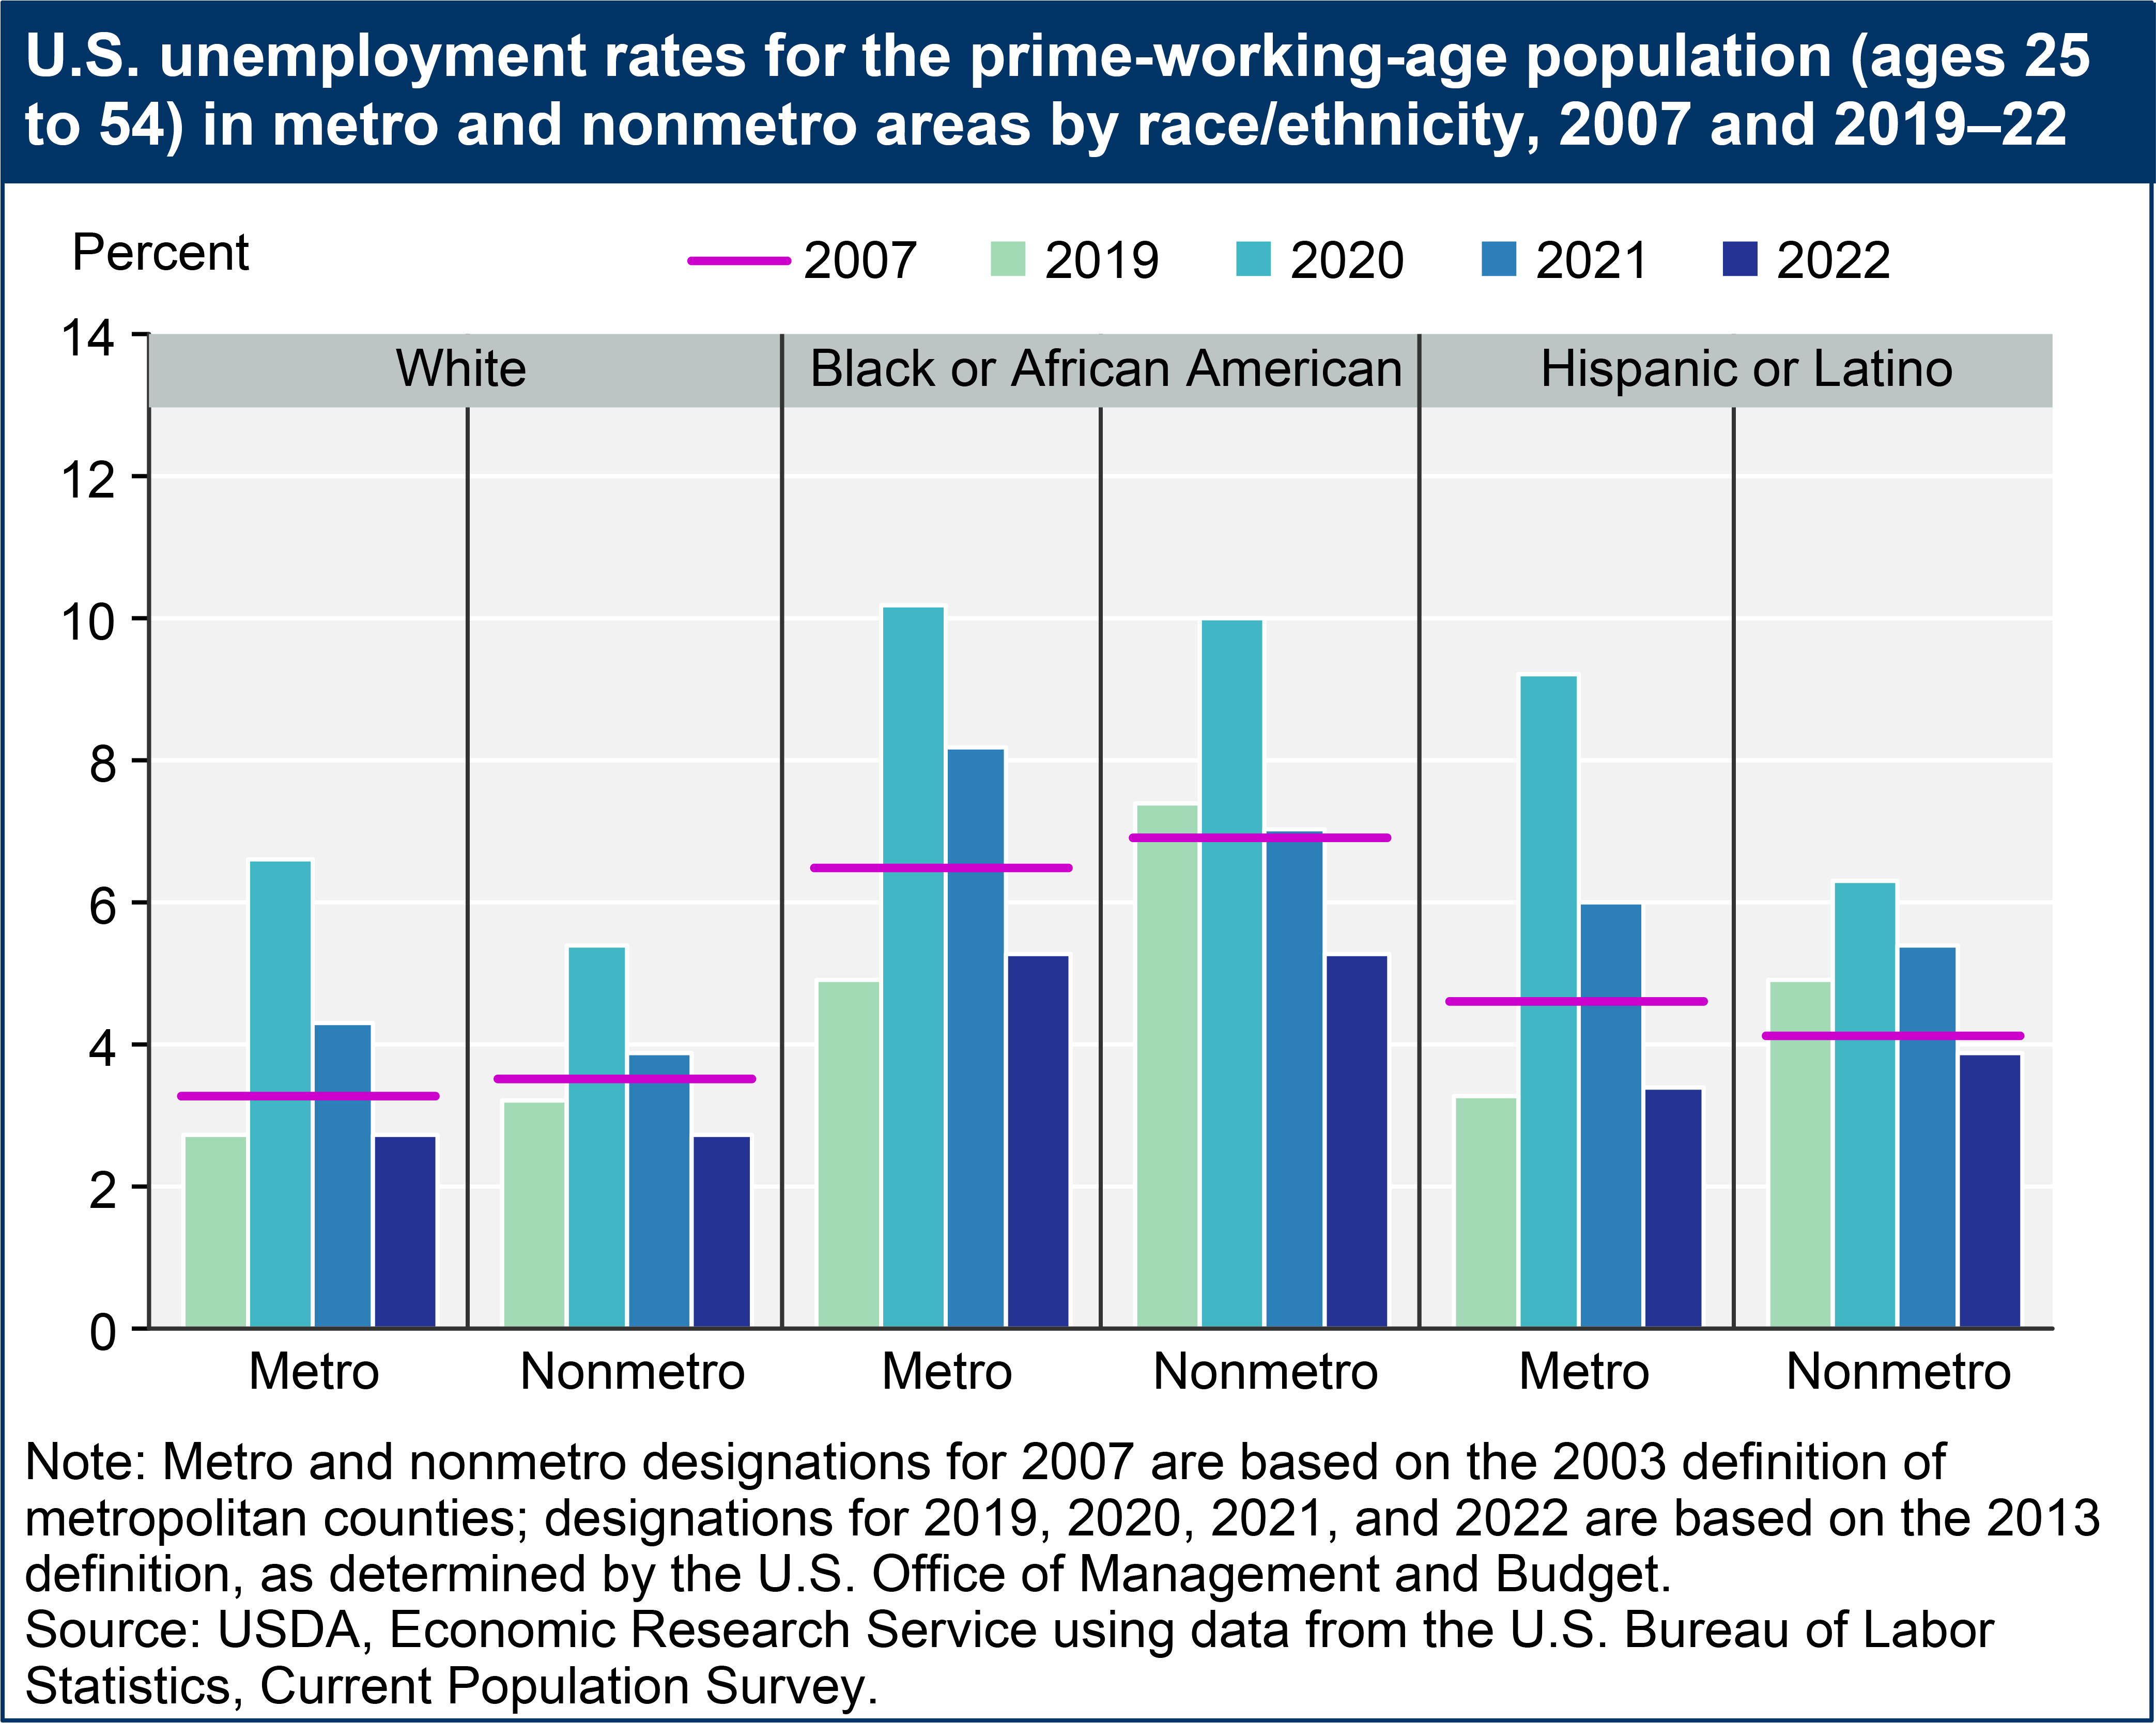
U.S. unemployment rates for the prime-working-age population (ages 25 to 54) in metro and nonmetro areas by race/ethnicity, 2007 and 2019–22
- by Austin Sanders
- 11/20/2023
Download chart image | Chart data
U.S. unemployment rates for the prime-working-age population (ages 25 to 54) in metro and nonmetro areas by race/ethnicity, 2007 and 2019–22