
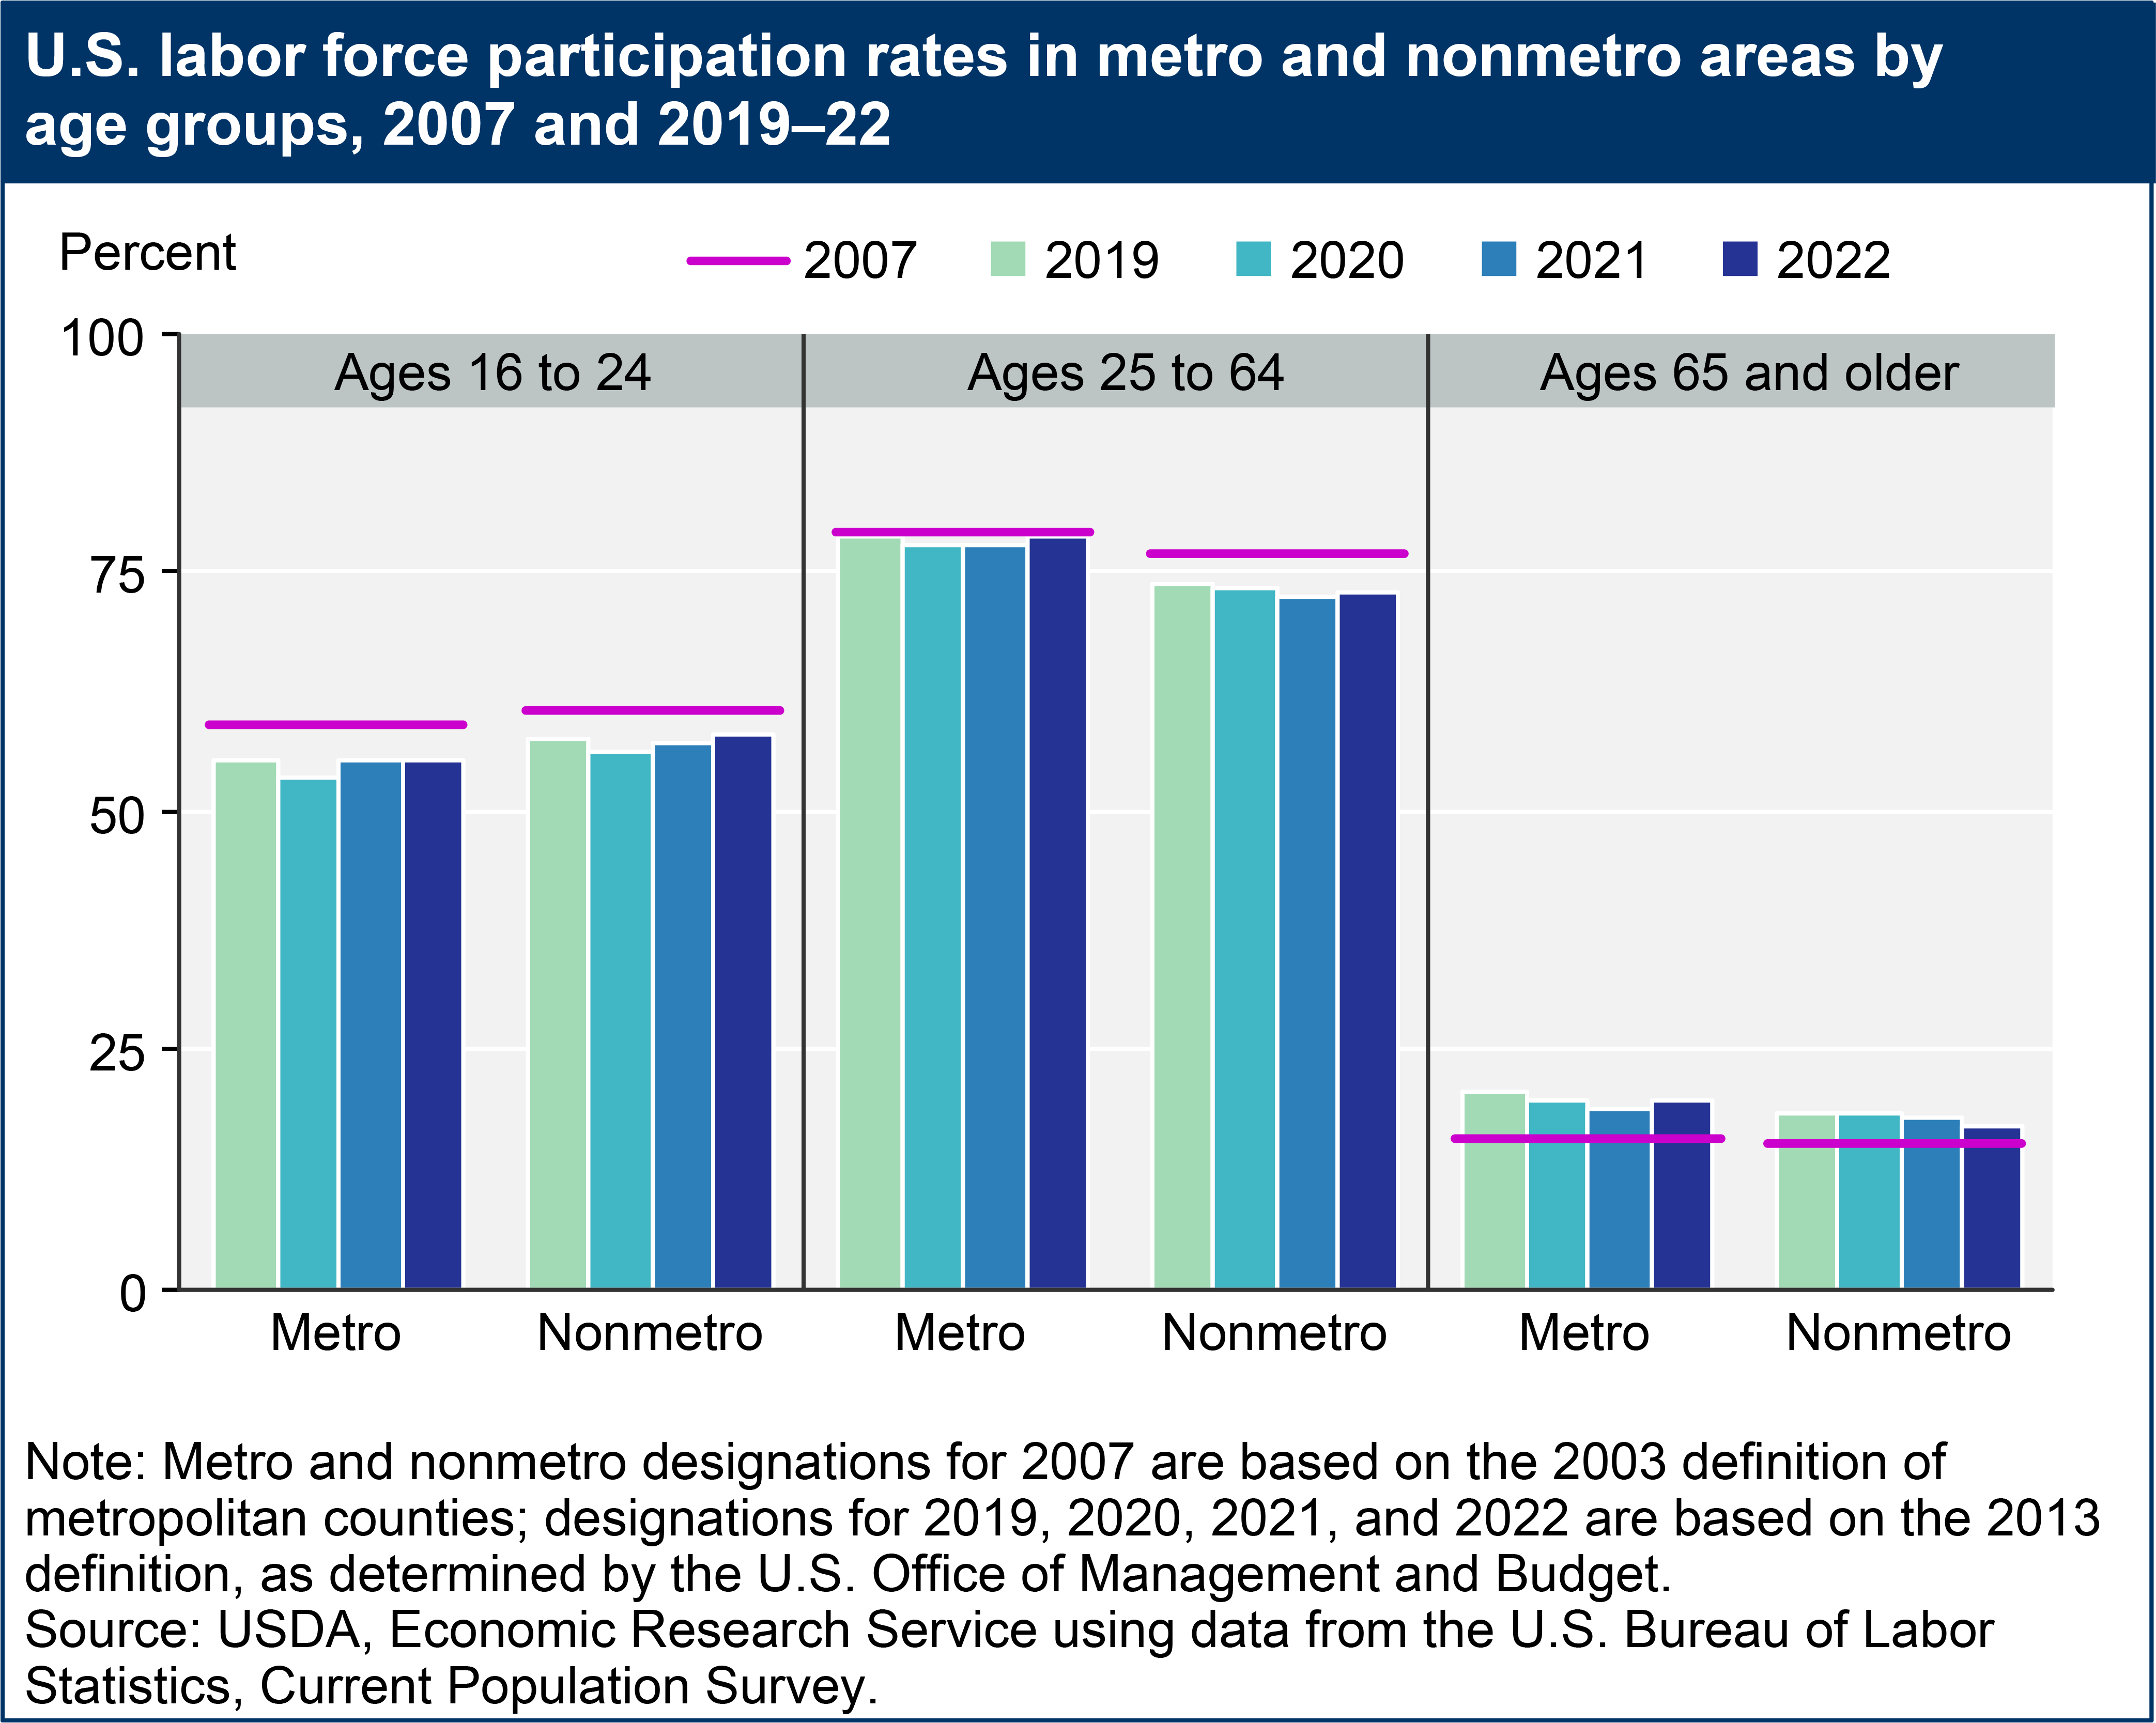
U.S. labor force participation rates in metro and nonmetro areas by age groups, 2007 and 2019–22
- by Austin Sanders
- 11/20/2023
Download chart image | Chart data
U.S. labor force participation rates in metro and nonmetro areas by age groups, 2007 and 2019–22
We’d welcome your feedback!
Would you be willing to answer a few quick questions about your experience?