
U.S. households that earn less spend a higher share of income on food
- by Megan Sweitzer
- 10/4/2023
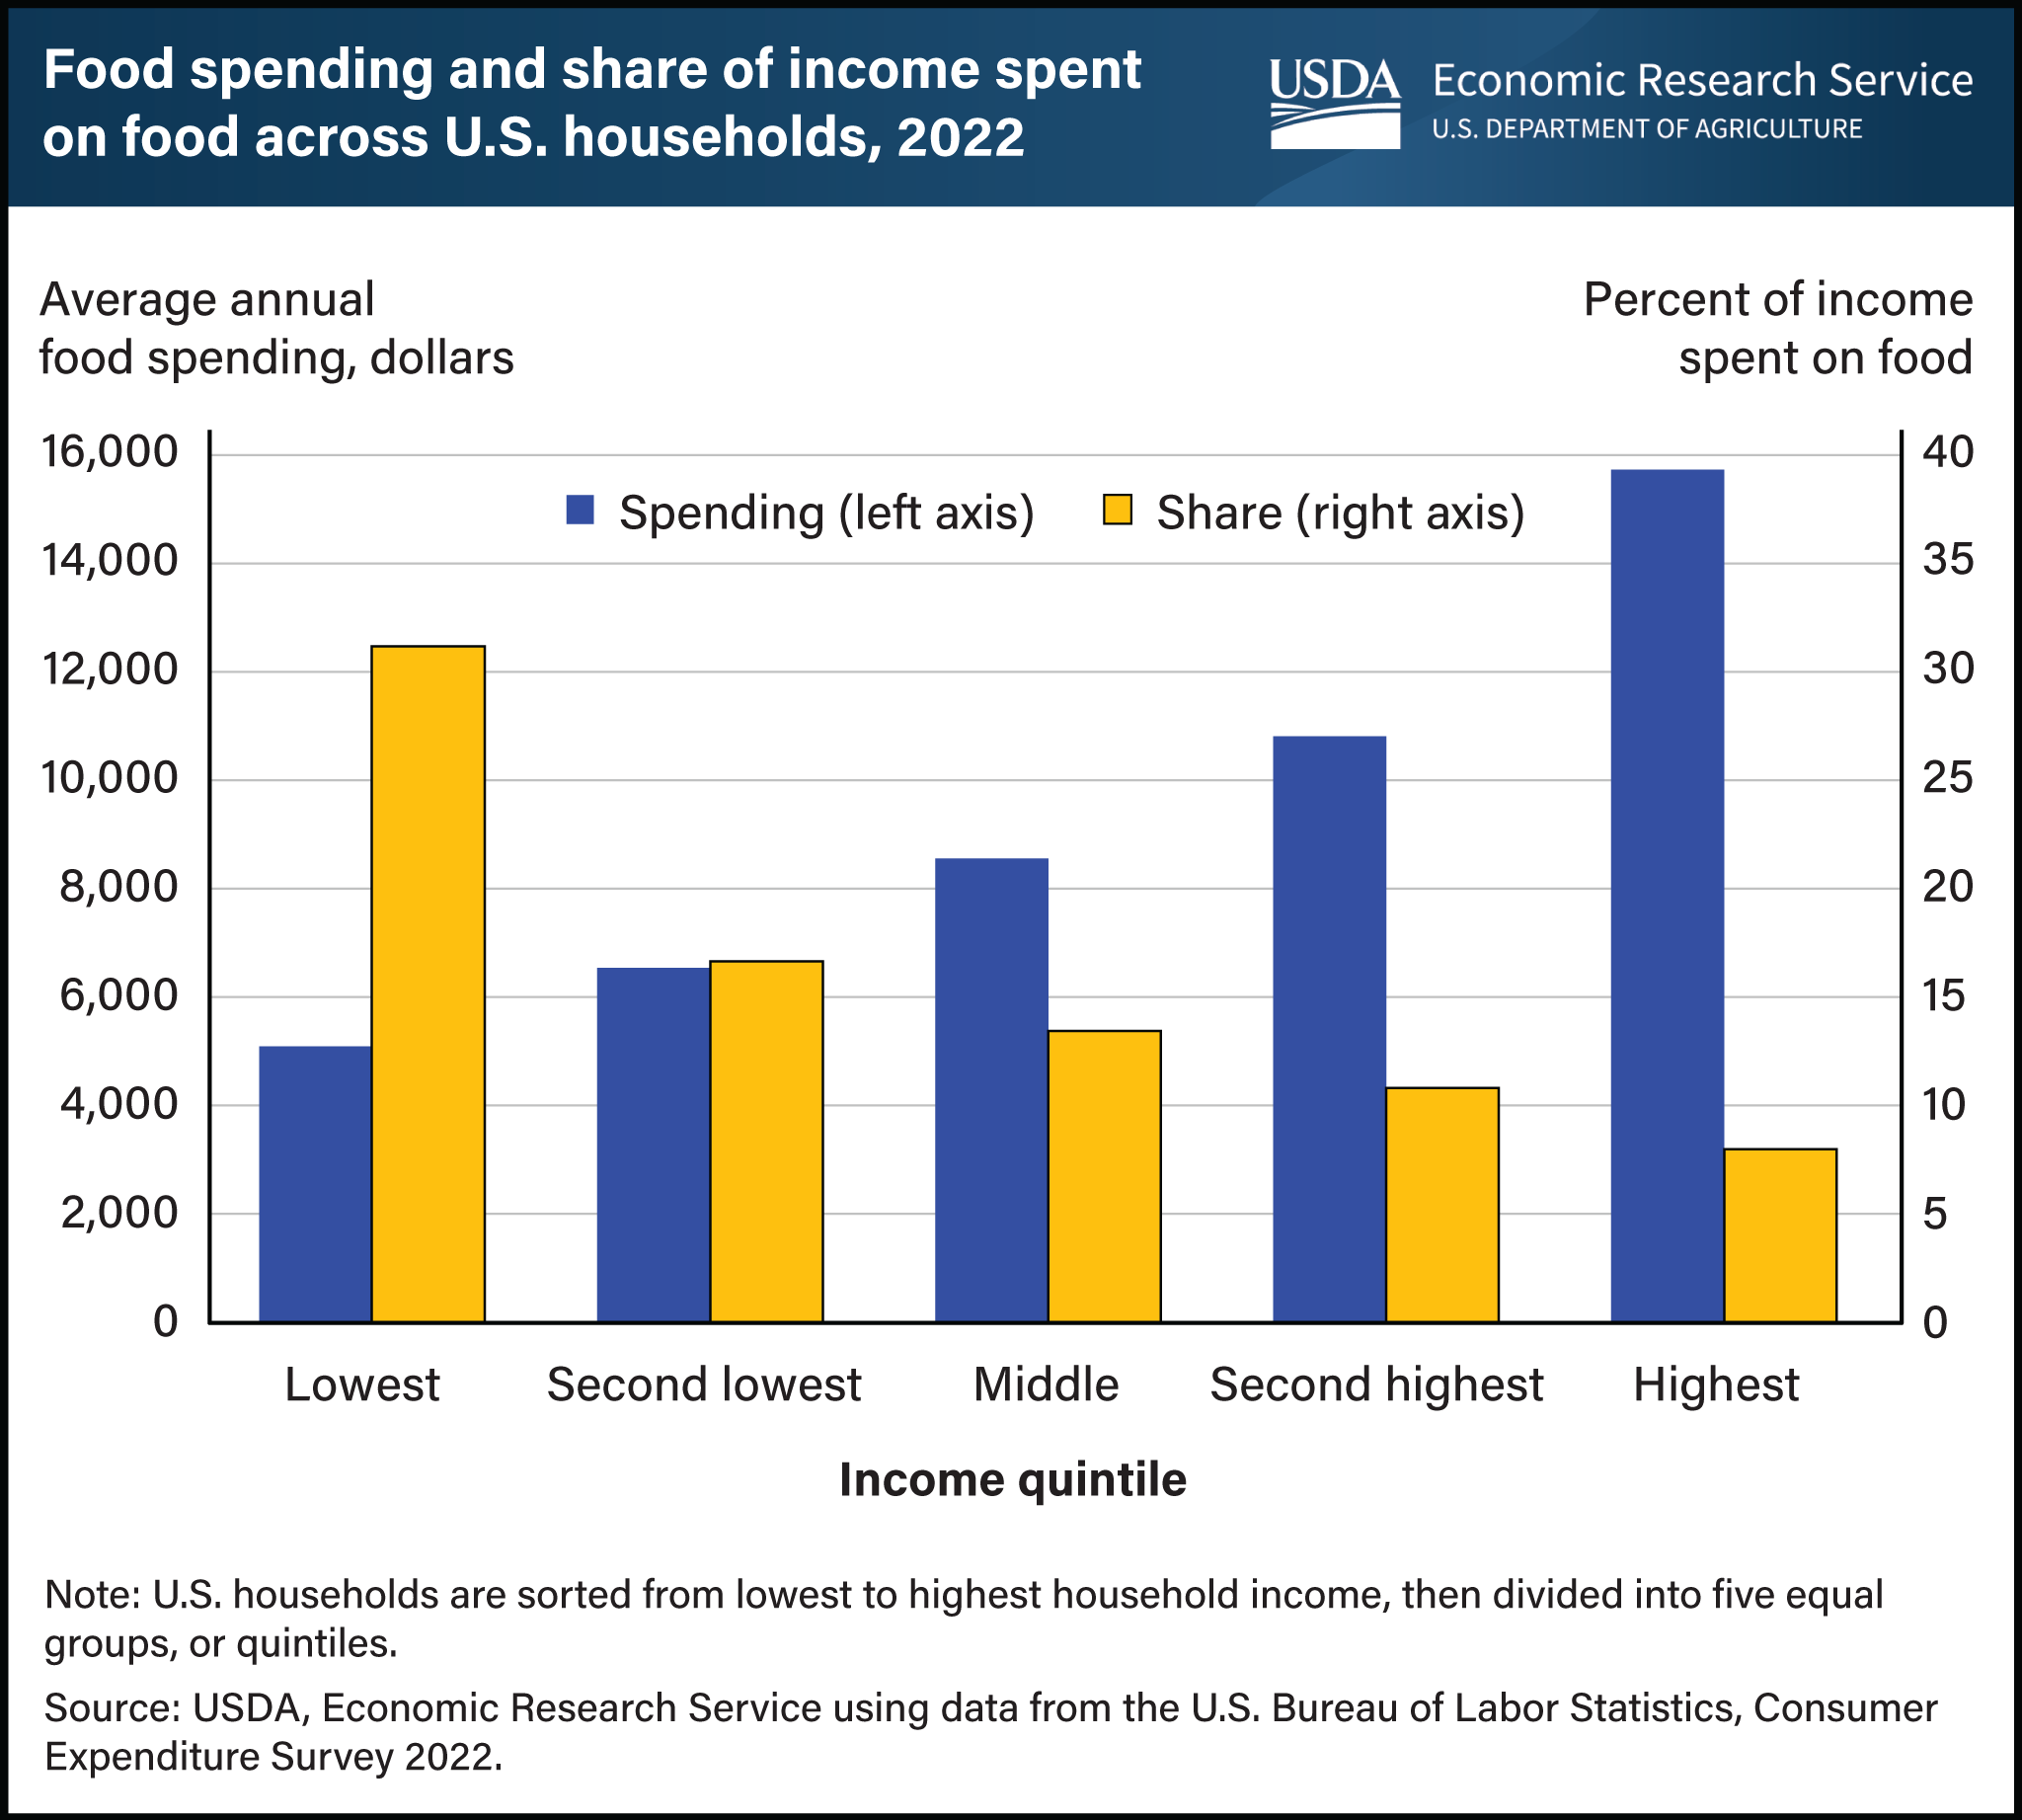
Households spend more money on food as their incomes rise, but the amount spent represents a smaller share of their overall budgets. When U.S. households were divided into five equal groups, or quintiles, by household income, households in the lowest income quintile had an average after-tax income of $16,337 and spent an average of $5,090 on food (about $98 a week) in 2022. Households in the highest income quintile, with an average after-tax income of $196,794, spent an average of $15,713 on food (about $302 a week) in 2022. As households gain more disposable income, they often shift to more expensive food options, including dining out. Food spending as a share of income rose across all income quintiles in 2022 as food prices increased faster than the overall inflation rate. Food prices increased 9.9 percent in 2022, the largest annual increase since 1979, and food-at-home (grocery) prices increased 11.4 percent. However, despite these large price increases, households’ share of income spent on food in 2022 was lower than in 2019 for the lowest three income quintiles and nearly the same for the highest two income quintiles. In 2022, food spending represented 31.2 percent of the lowest quintile’s income, 13.4 percent of income for the middle quintile, and 8.0 percent of income for the highest quintile. This chart appears in the Food Prices and Spending section of the USDA, Economic Research Service’s Ag and Food Statistics: Charting the Essentials data product.