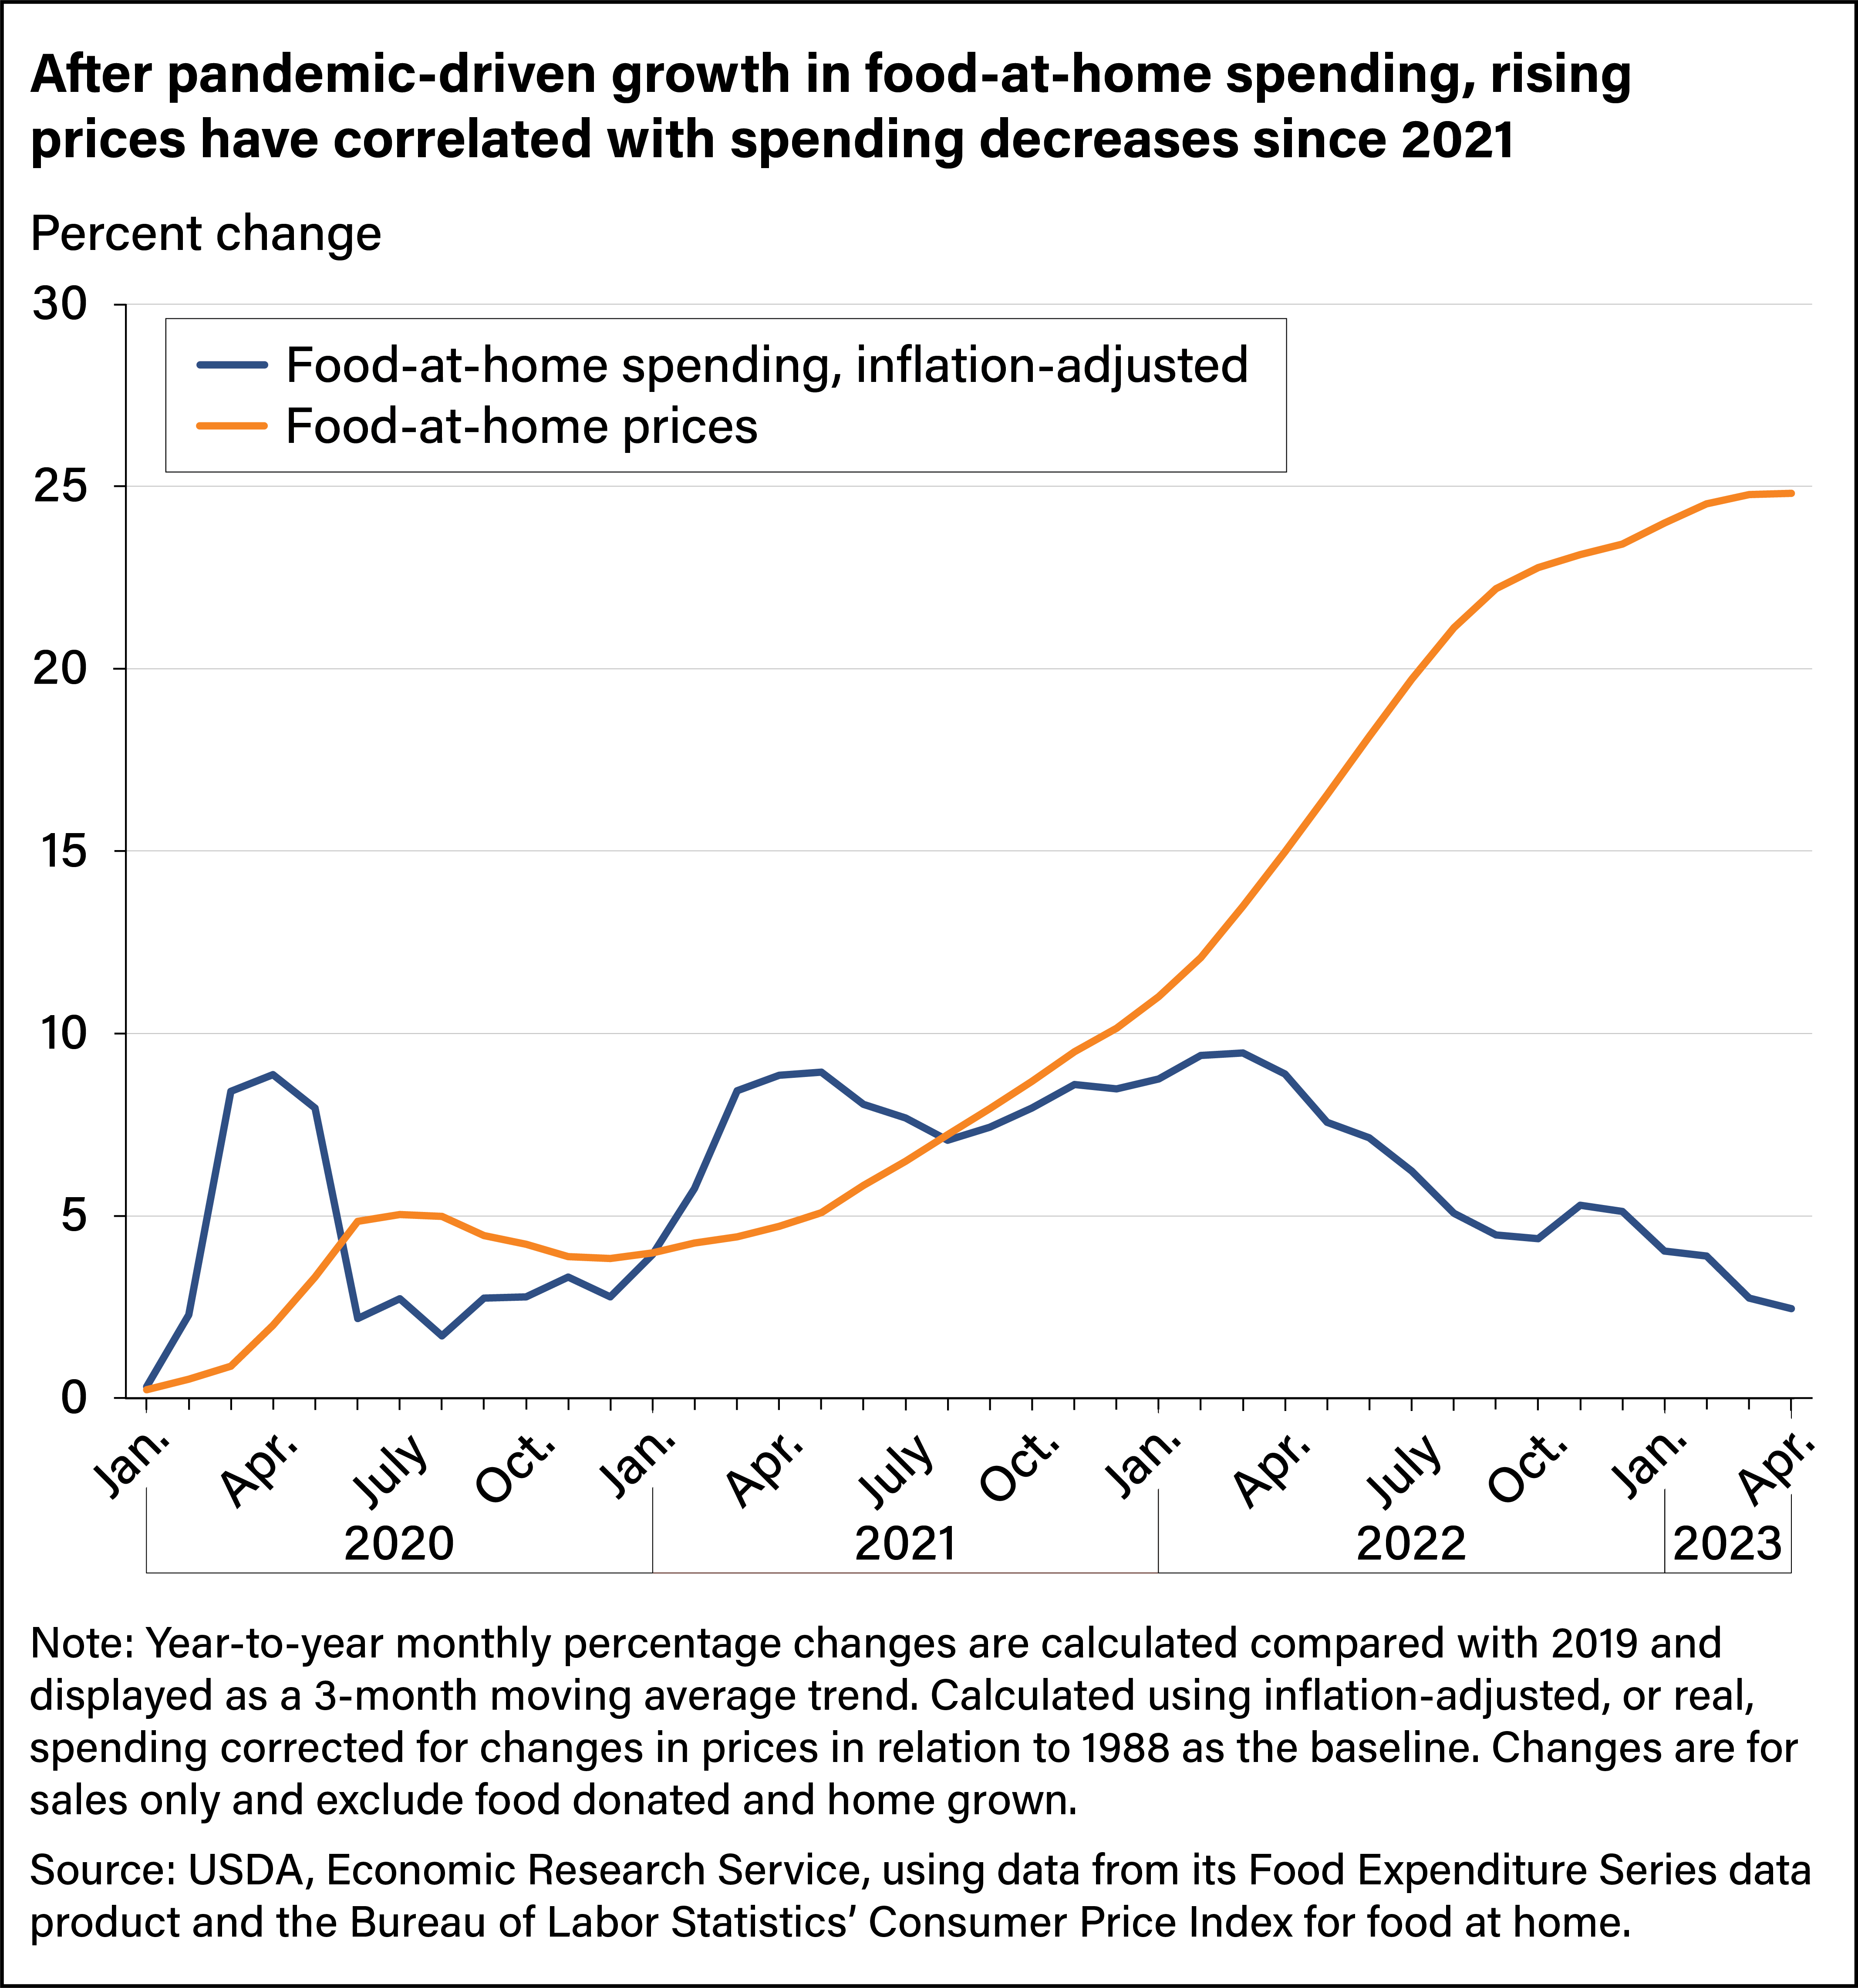
After pandemic-driven growth in food-at-home-spending, rising prices have correlated with spending decreases since 2021
- by Eliana Zeballos and Wilson Sinclair
- 9/25/2023

Adjusted for inflation, U.S. annual food spending increased 70 percent from 1997 to 2022 to the highest level recorded. The 25-year climb was steady other than slight decreases during the Great Recession in 2008 and 2009 and a 6.4 percent drop in 2020 during the COVID-19 pandemic.
