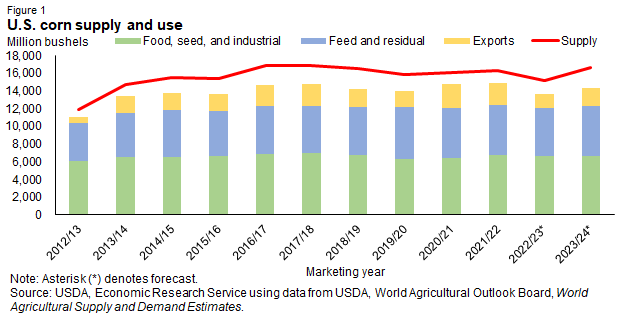
U.S. corn supply and use
- by Aaron M. Ates and Angelica Williams
- 9/14/2023
Official websites use .gov
A .gov website belongs to an official government organization in the United States.
Secure .gov websites use HTTPS
A lock (
) or https:// means you’ve safely connected to the .gov website. Share sensitive information only on official, secure websites.