
Limited-service restaurants: Share of total establishments doubles, total number of establishments triples, 1990–2019
- by Keenan Marchesi
- 6/21/2023
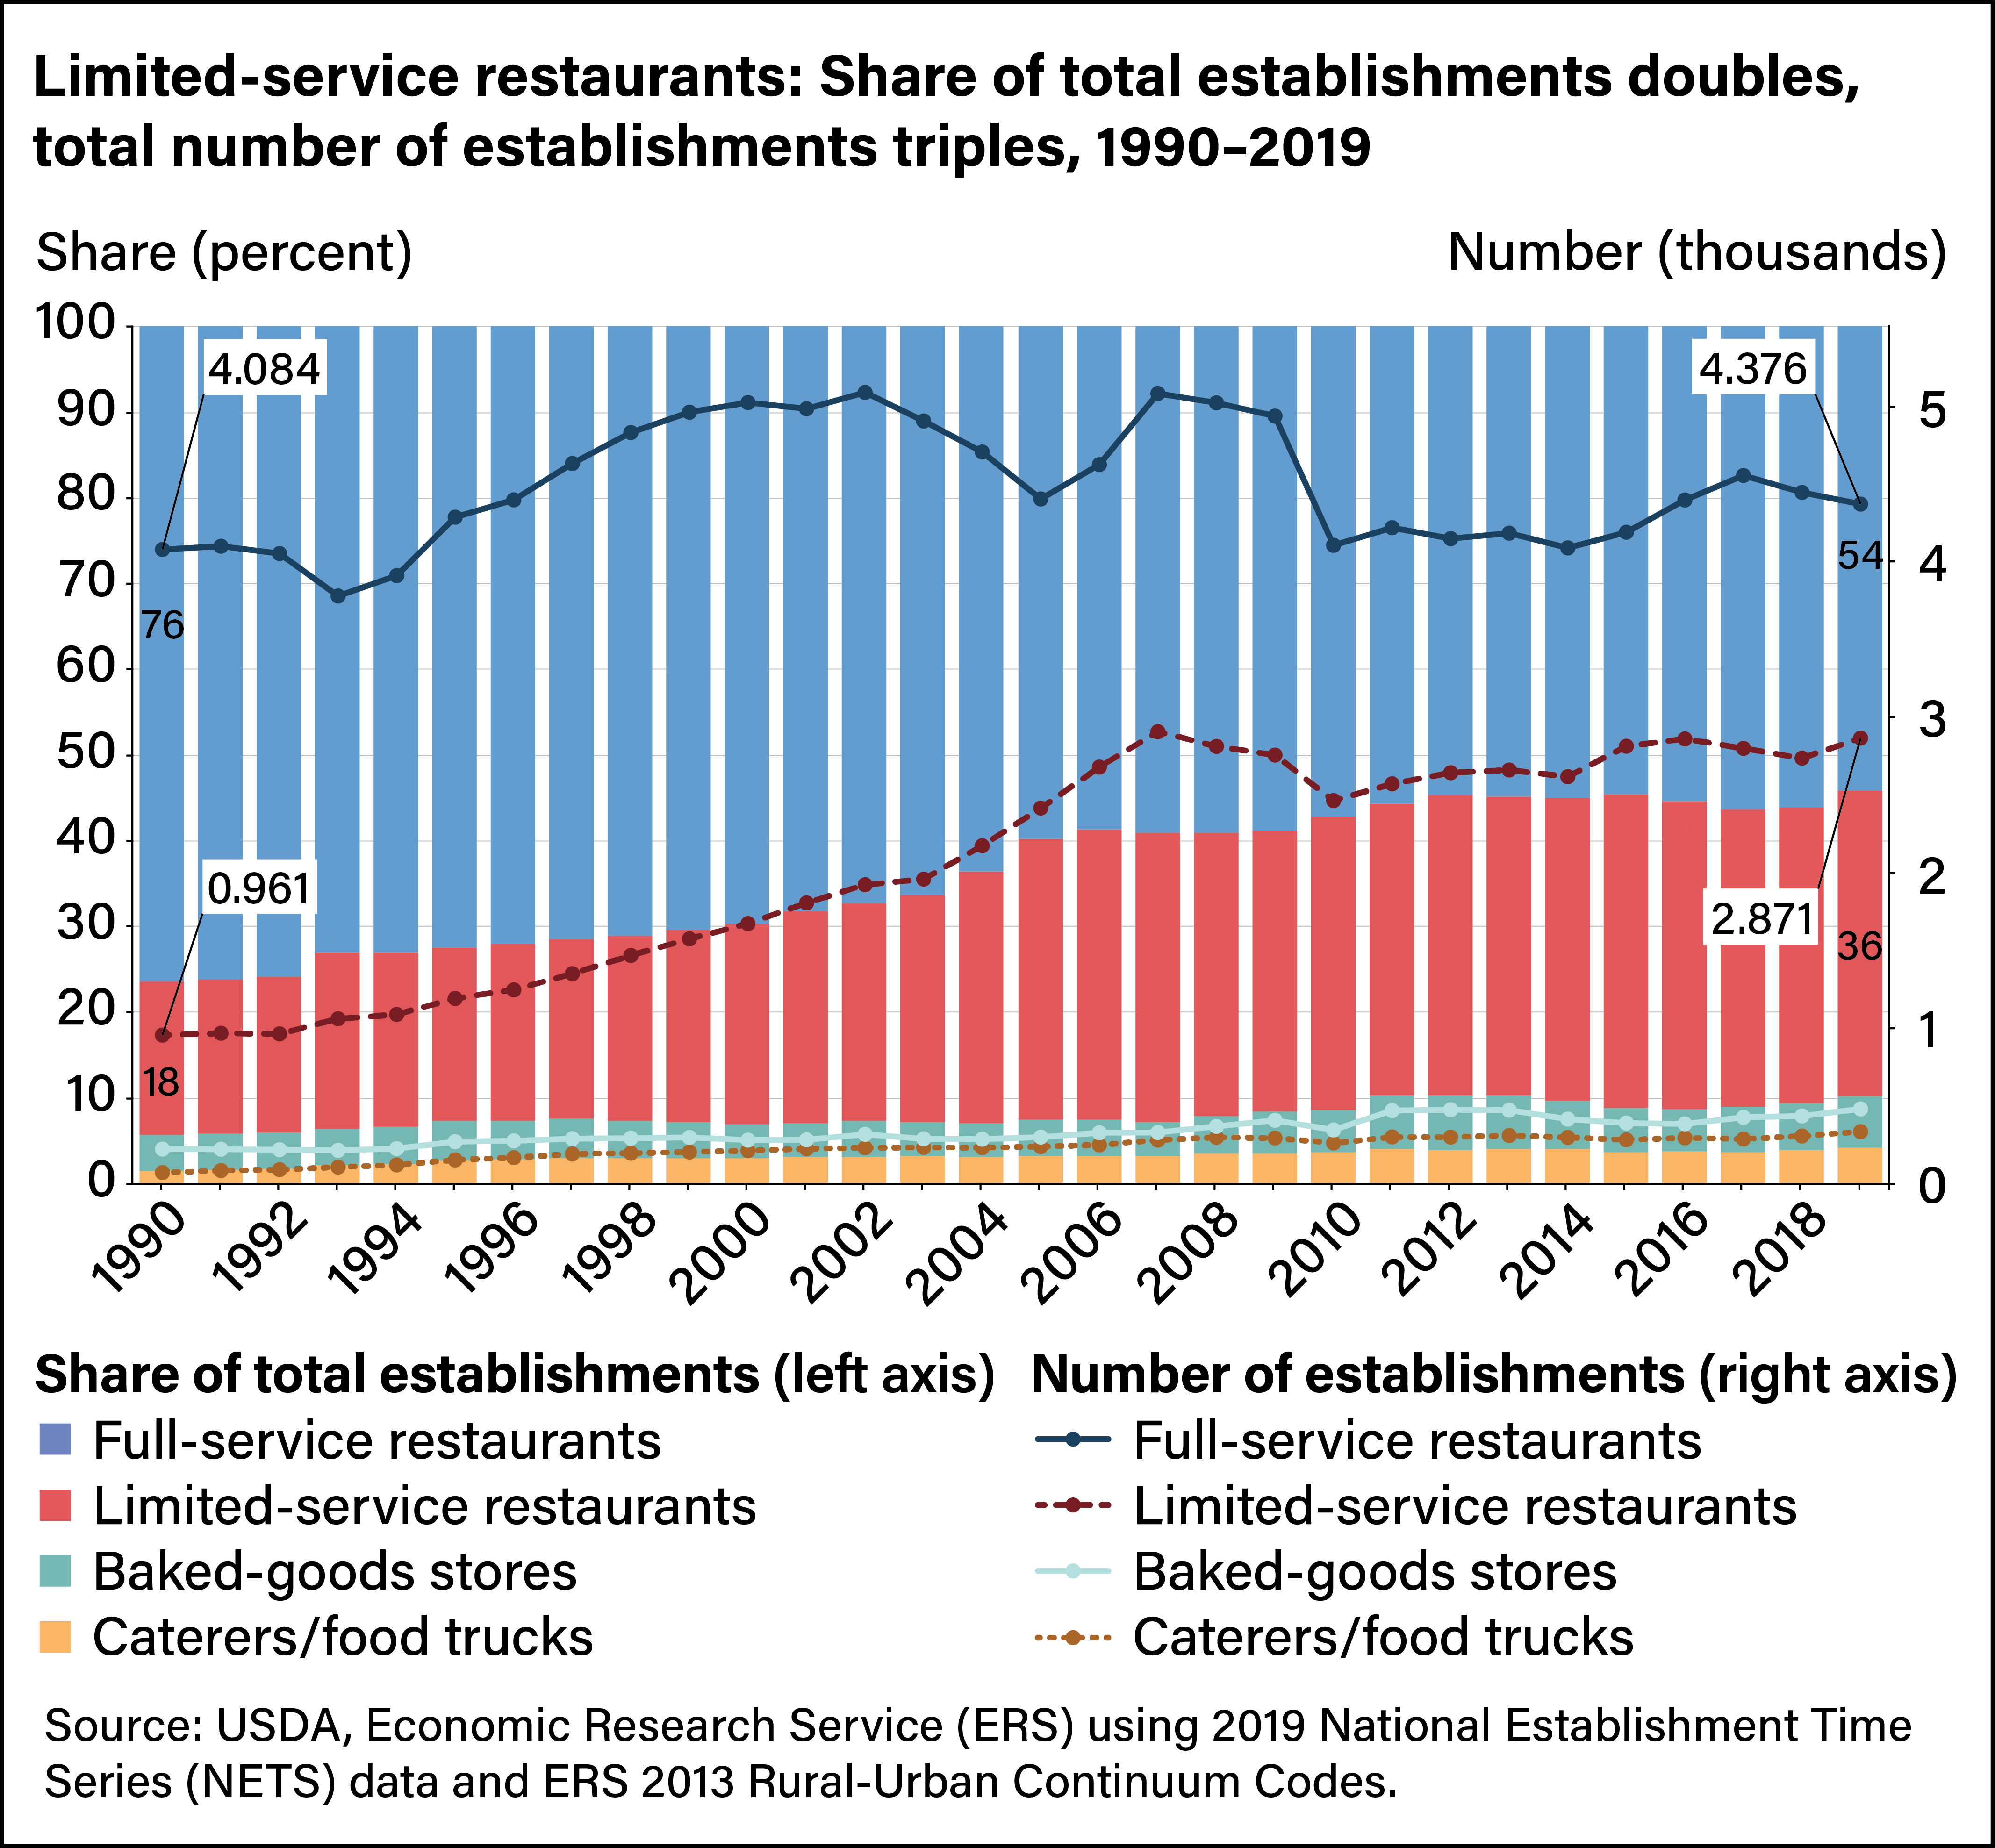
Bar and line chart comparing numbers of full-service restaurants, limited-service restaurants, baked-goods stores, and caterers/food trucks with their market shares from 1990 to 2019.