
‘All other food at home’ spending changes varied by household race and ethnicity between 2016–19 and 2020
- by Abigail Okrent and Eliana Zeballos
- 5/31/2023
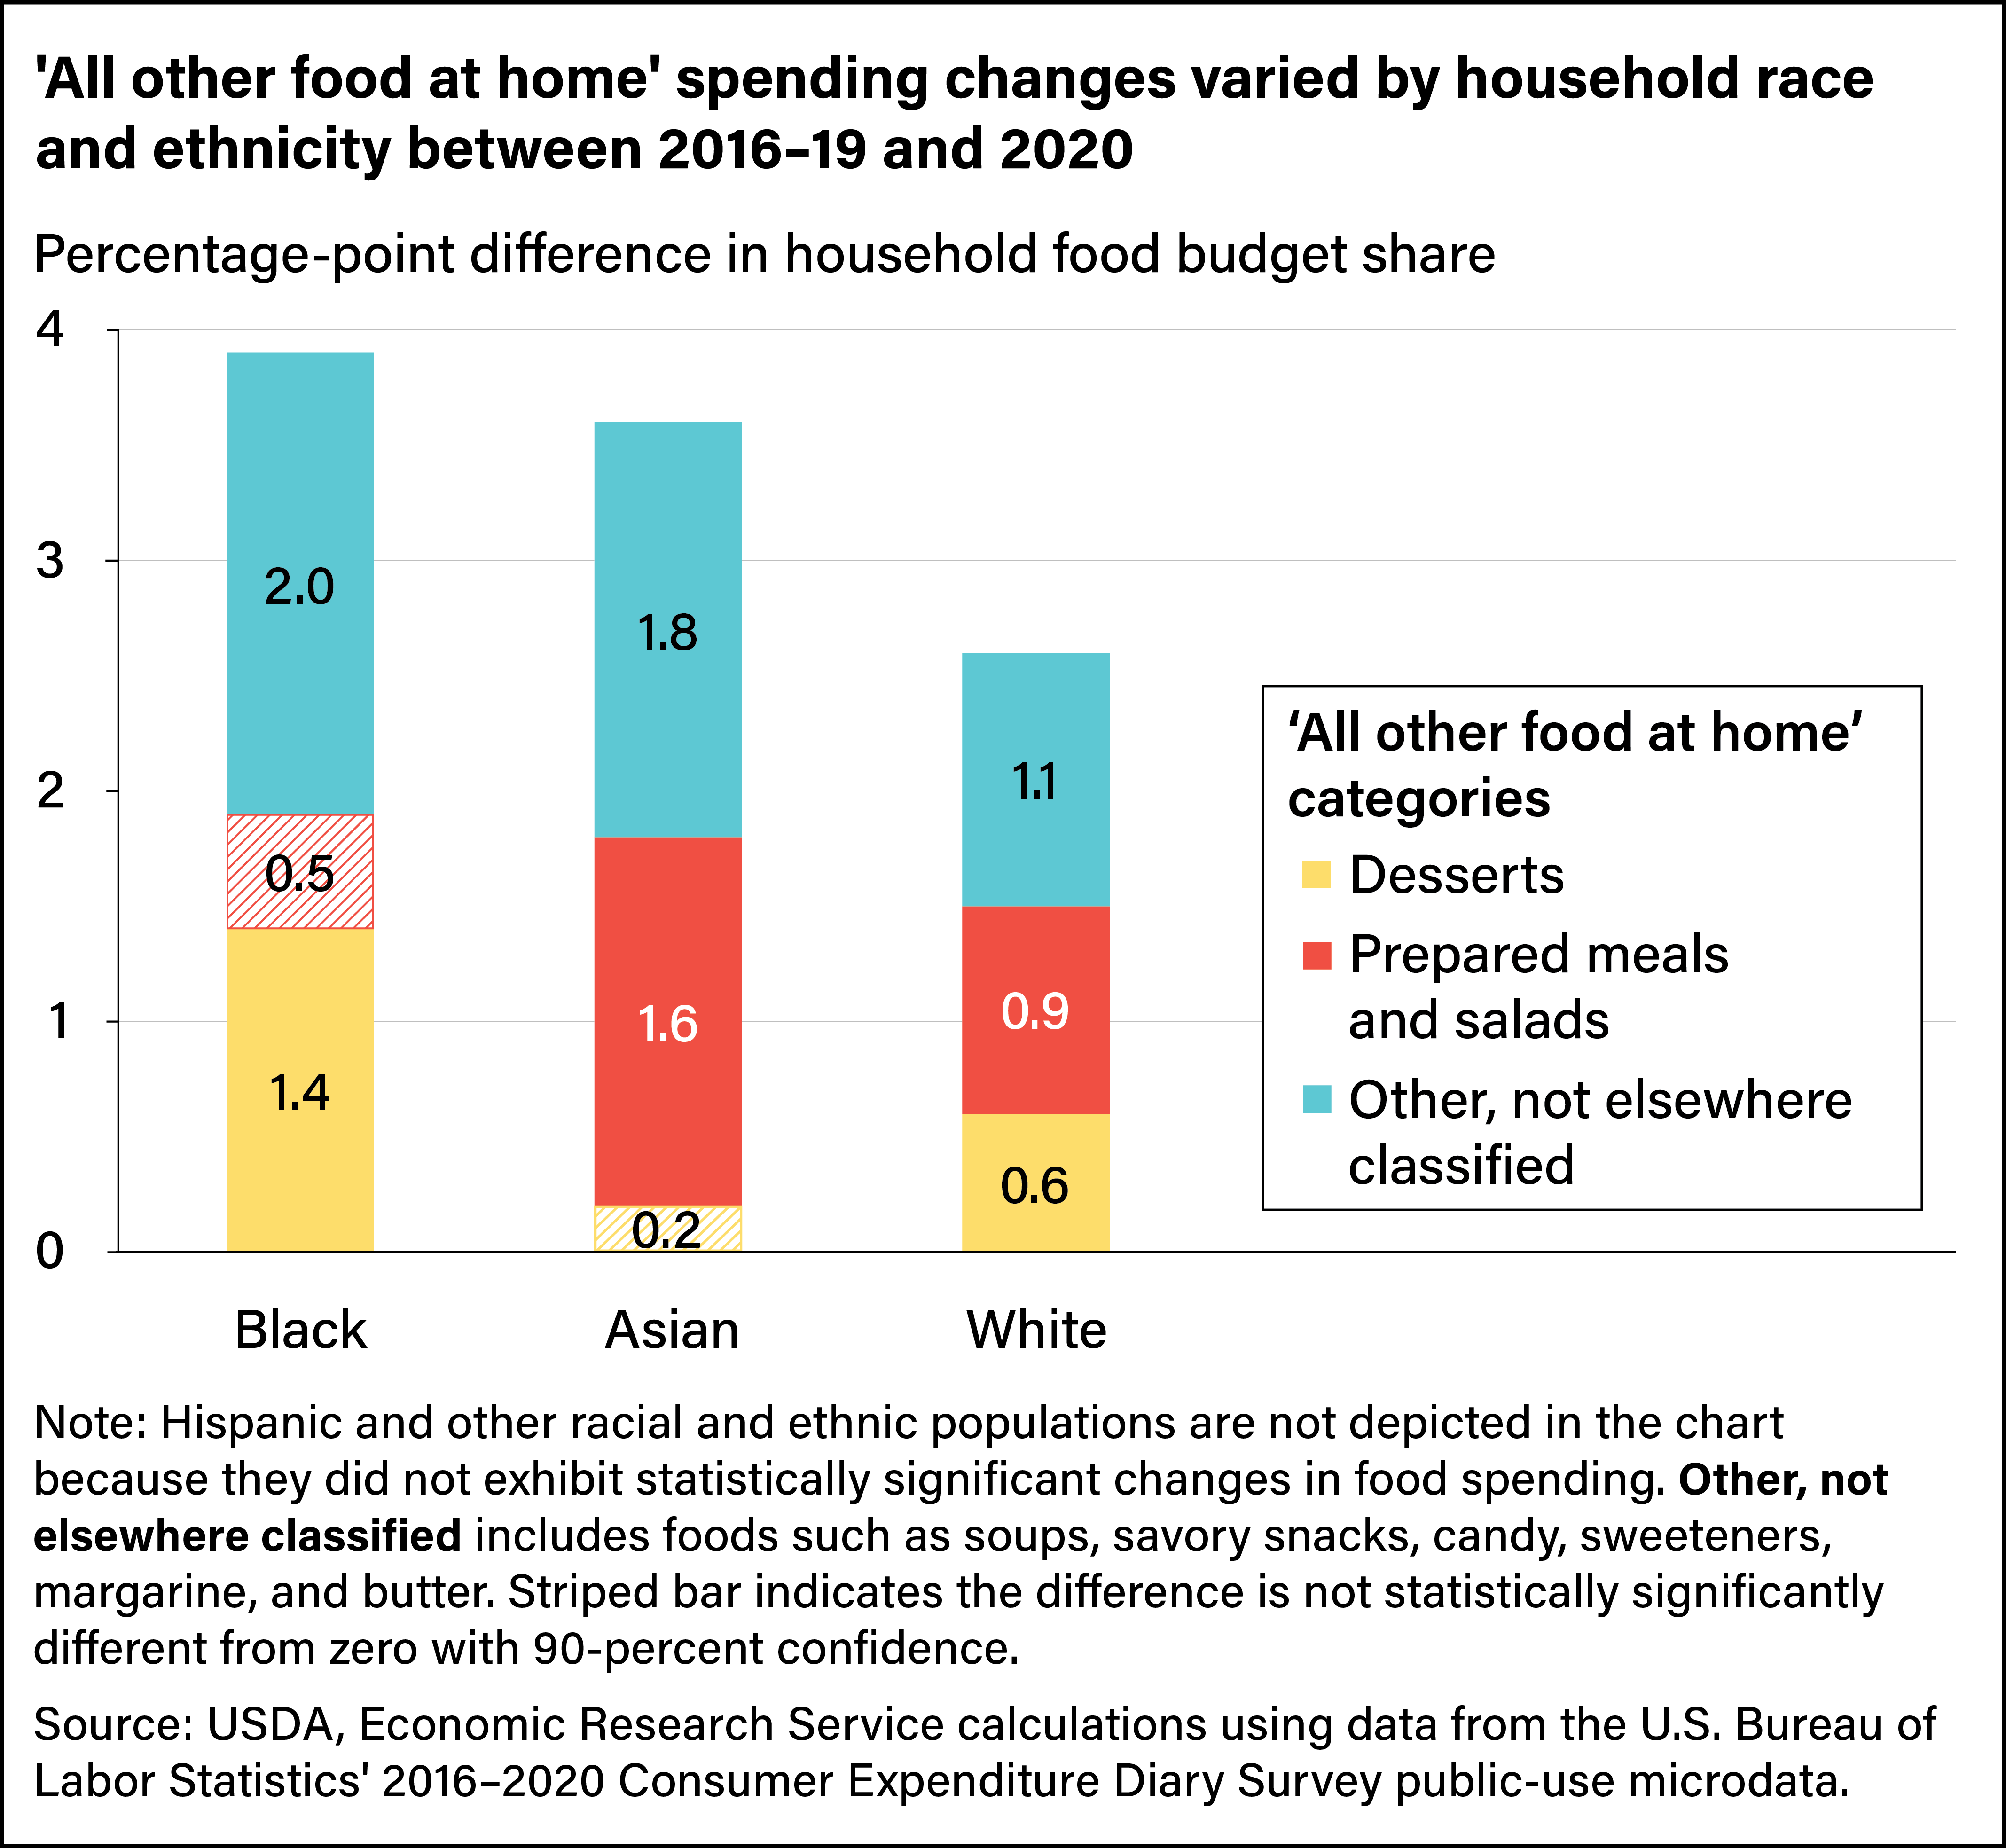
Bar chart comparing percentage-point differences in household food budget shares for the “all other food at home” categories among Black, Asian, and White consumers in 2020 compared with 2016–19.