
Food-at-home spending grew in 2020 from 2016–19, led by ‘all other food at home’ category
- by Abigail Okrent and Eliana Zeballos
- 5/31/2023
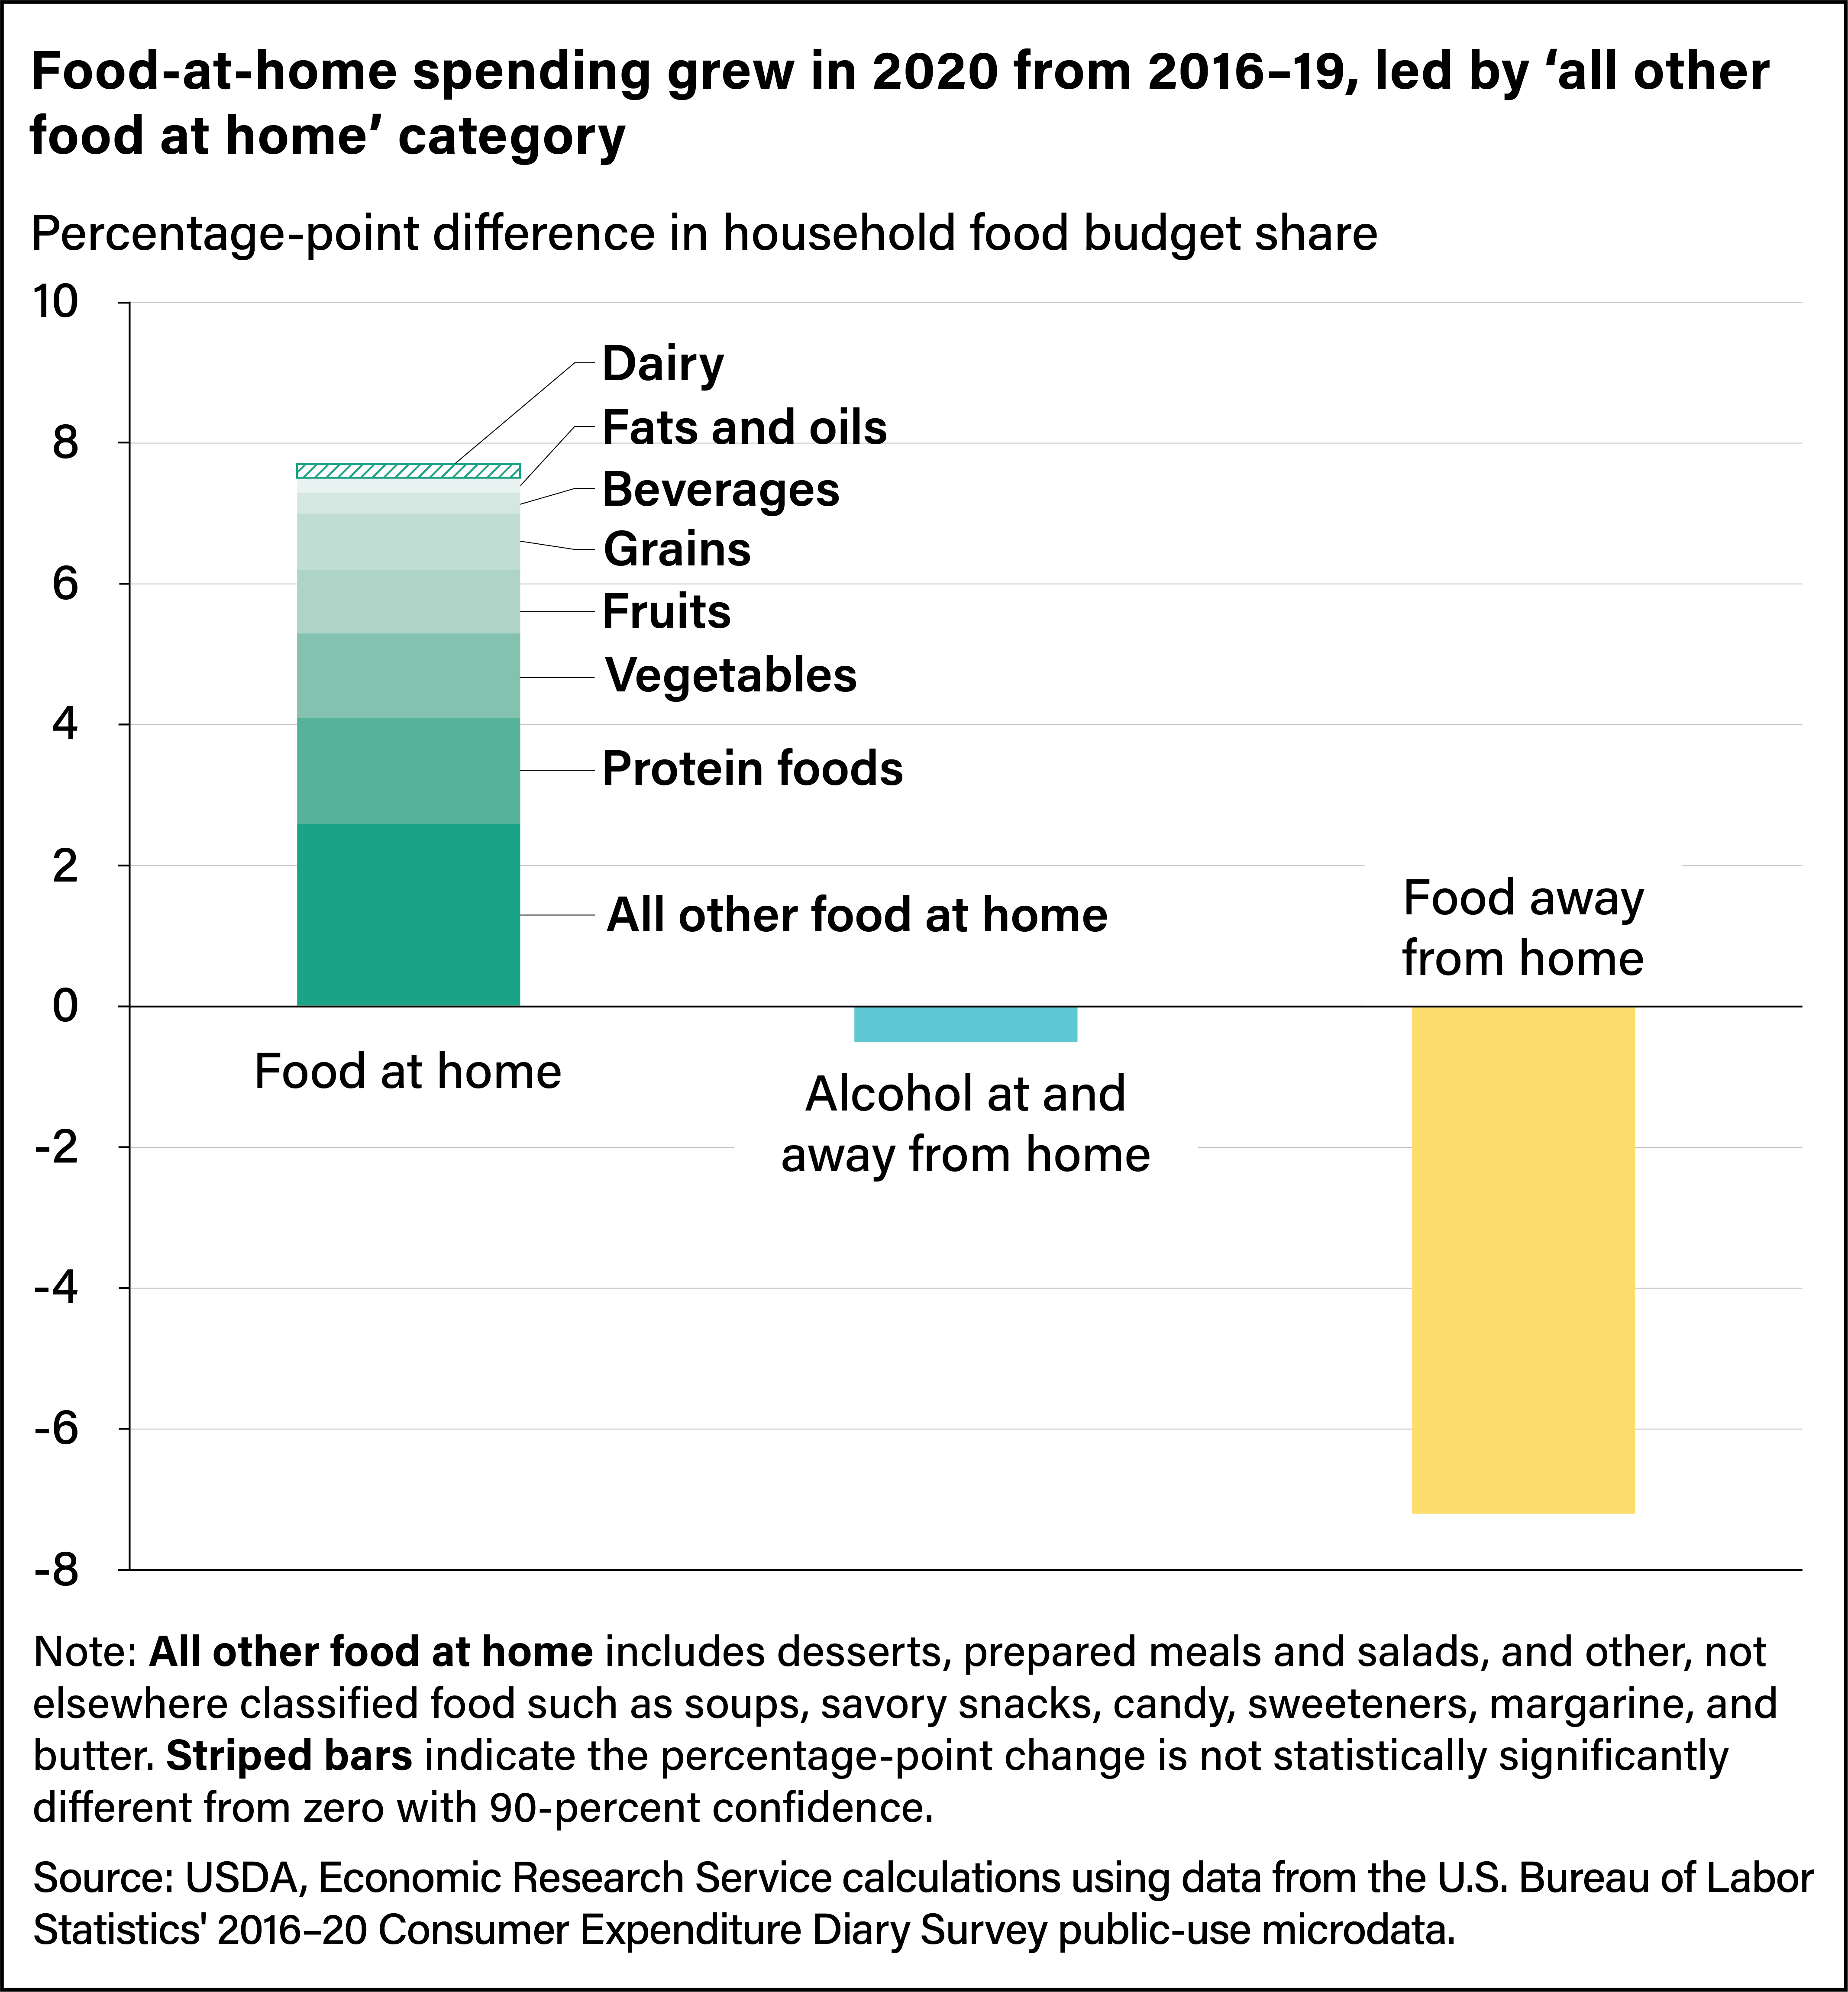
Bar chart showing percentage-point differences in household budget shares in 2020 compared with 2016–19 for food at home, alcohol at and away from home, and food away from home.