
Socially disadvantaged farm operations concentrated in South and West
- by Scott Callahan
- 5/16/2023
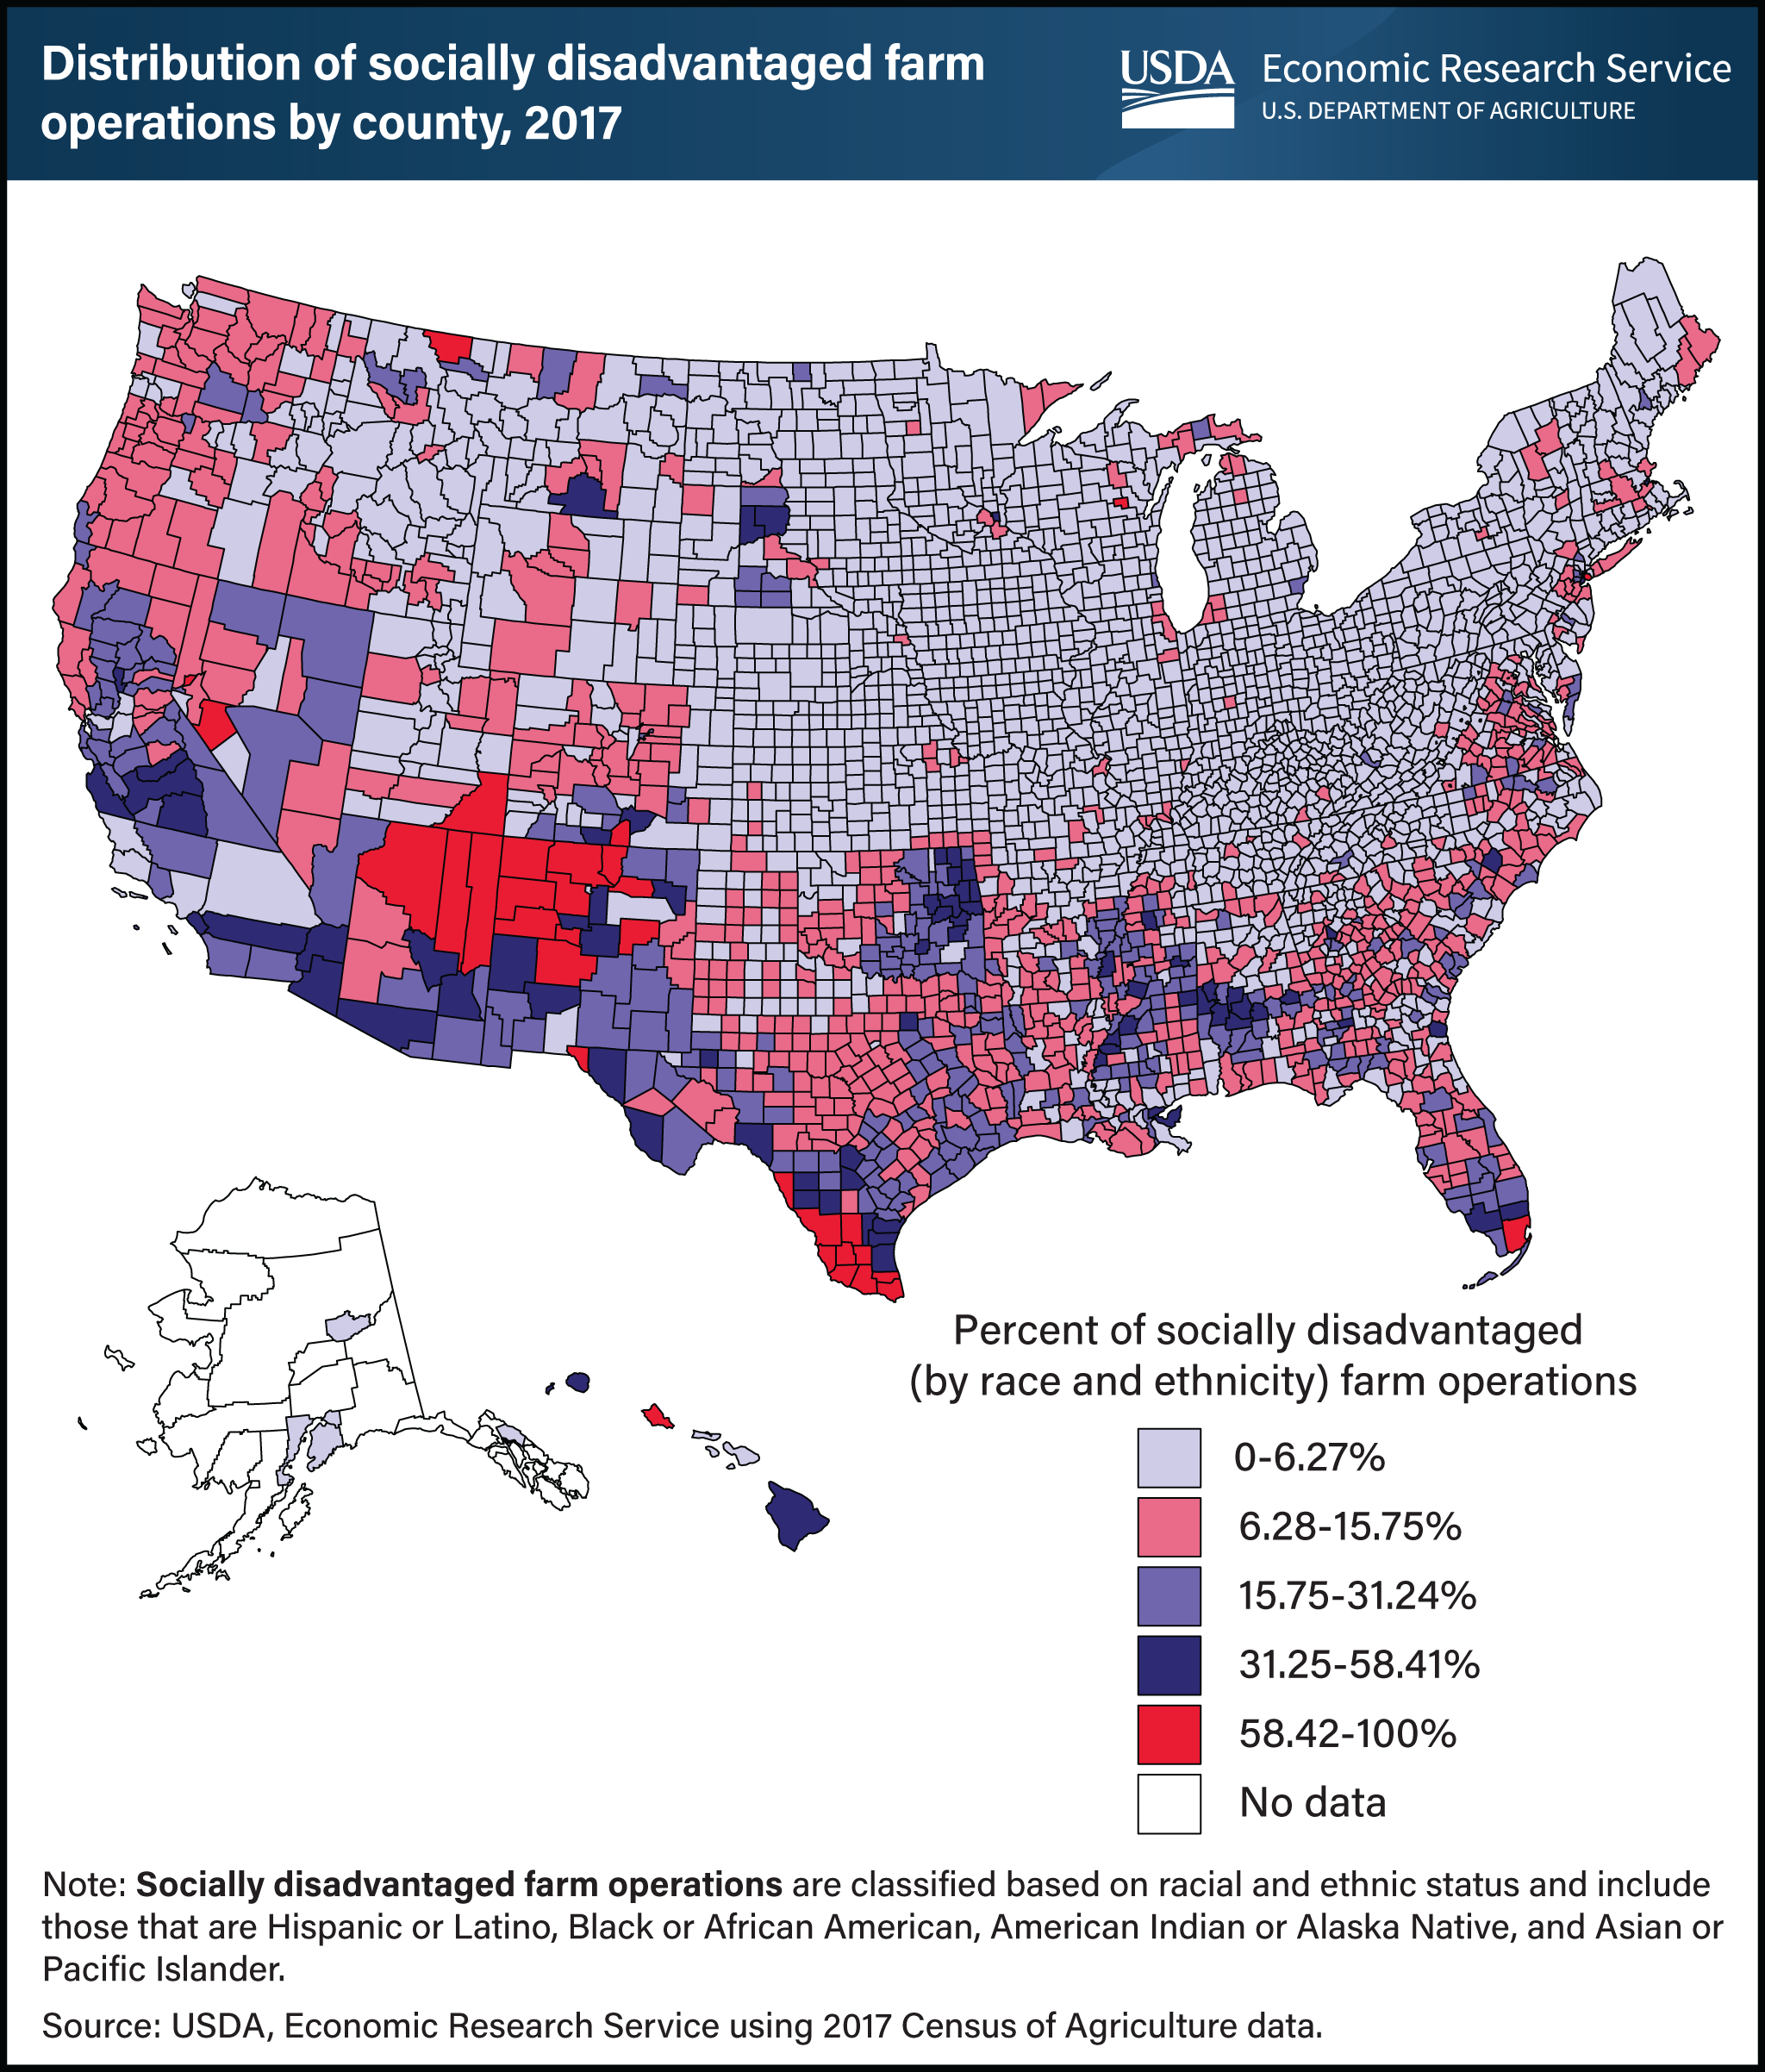
Socially disadvantaged farmers and ranchers tend to be more concentrated in southern and western regions of the country than in other areas of the United States. USDA defines socially disadvantaged farmers and ranchers as those belonging to groups that have been subject to racial or ethnic prejudice. They include non-white and Hispanic farmers. In some counties, the proportion of operations classified as racially or ethnically socially disadvantaged is more than 58 percent, such as in parts of Arizona, New Mexico, Texas, and Florida. Overall, socially disadvantaged farms accounted for 9.4 percent of the 2 million farms in the United States, according to the 2017 Census of Agriculture. In 2017, 1.3 percent of all producers identified themselves as Black or African American only, 1.7 percent identified as American Indian or Alaska Native only, 0.6 percent identified as Asian only, 0.1 percent as Native Hawaiian or other Pacific Islander only, and 0.8 percent of all producers reported more than one race. In addition, 3.3 percent of all producers of any race indicated Hispanic, Latino, or Spanish origin. This chart appears in the USDA, Economic Research Service report Access to Farmland by Beginning and Socially Disadvantaged Farmers: Issues and Opportunities, published in December 2022.