
Hiring of H-2A workers has increased for farm labor contractors (FLCs) and individual employers since 2012
- by Marcelo Castillo
- 3/13/2023
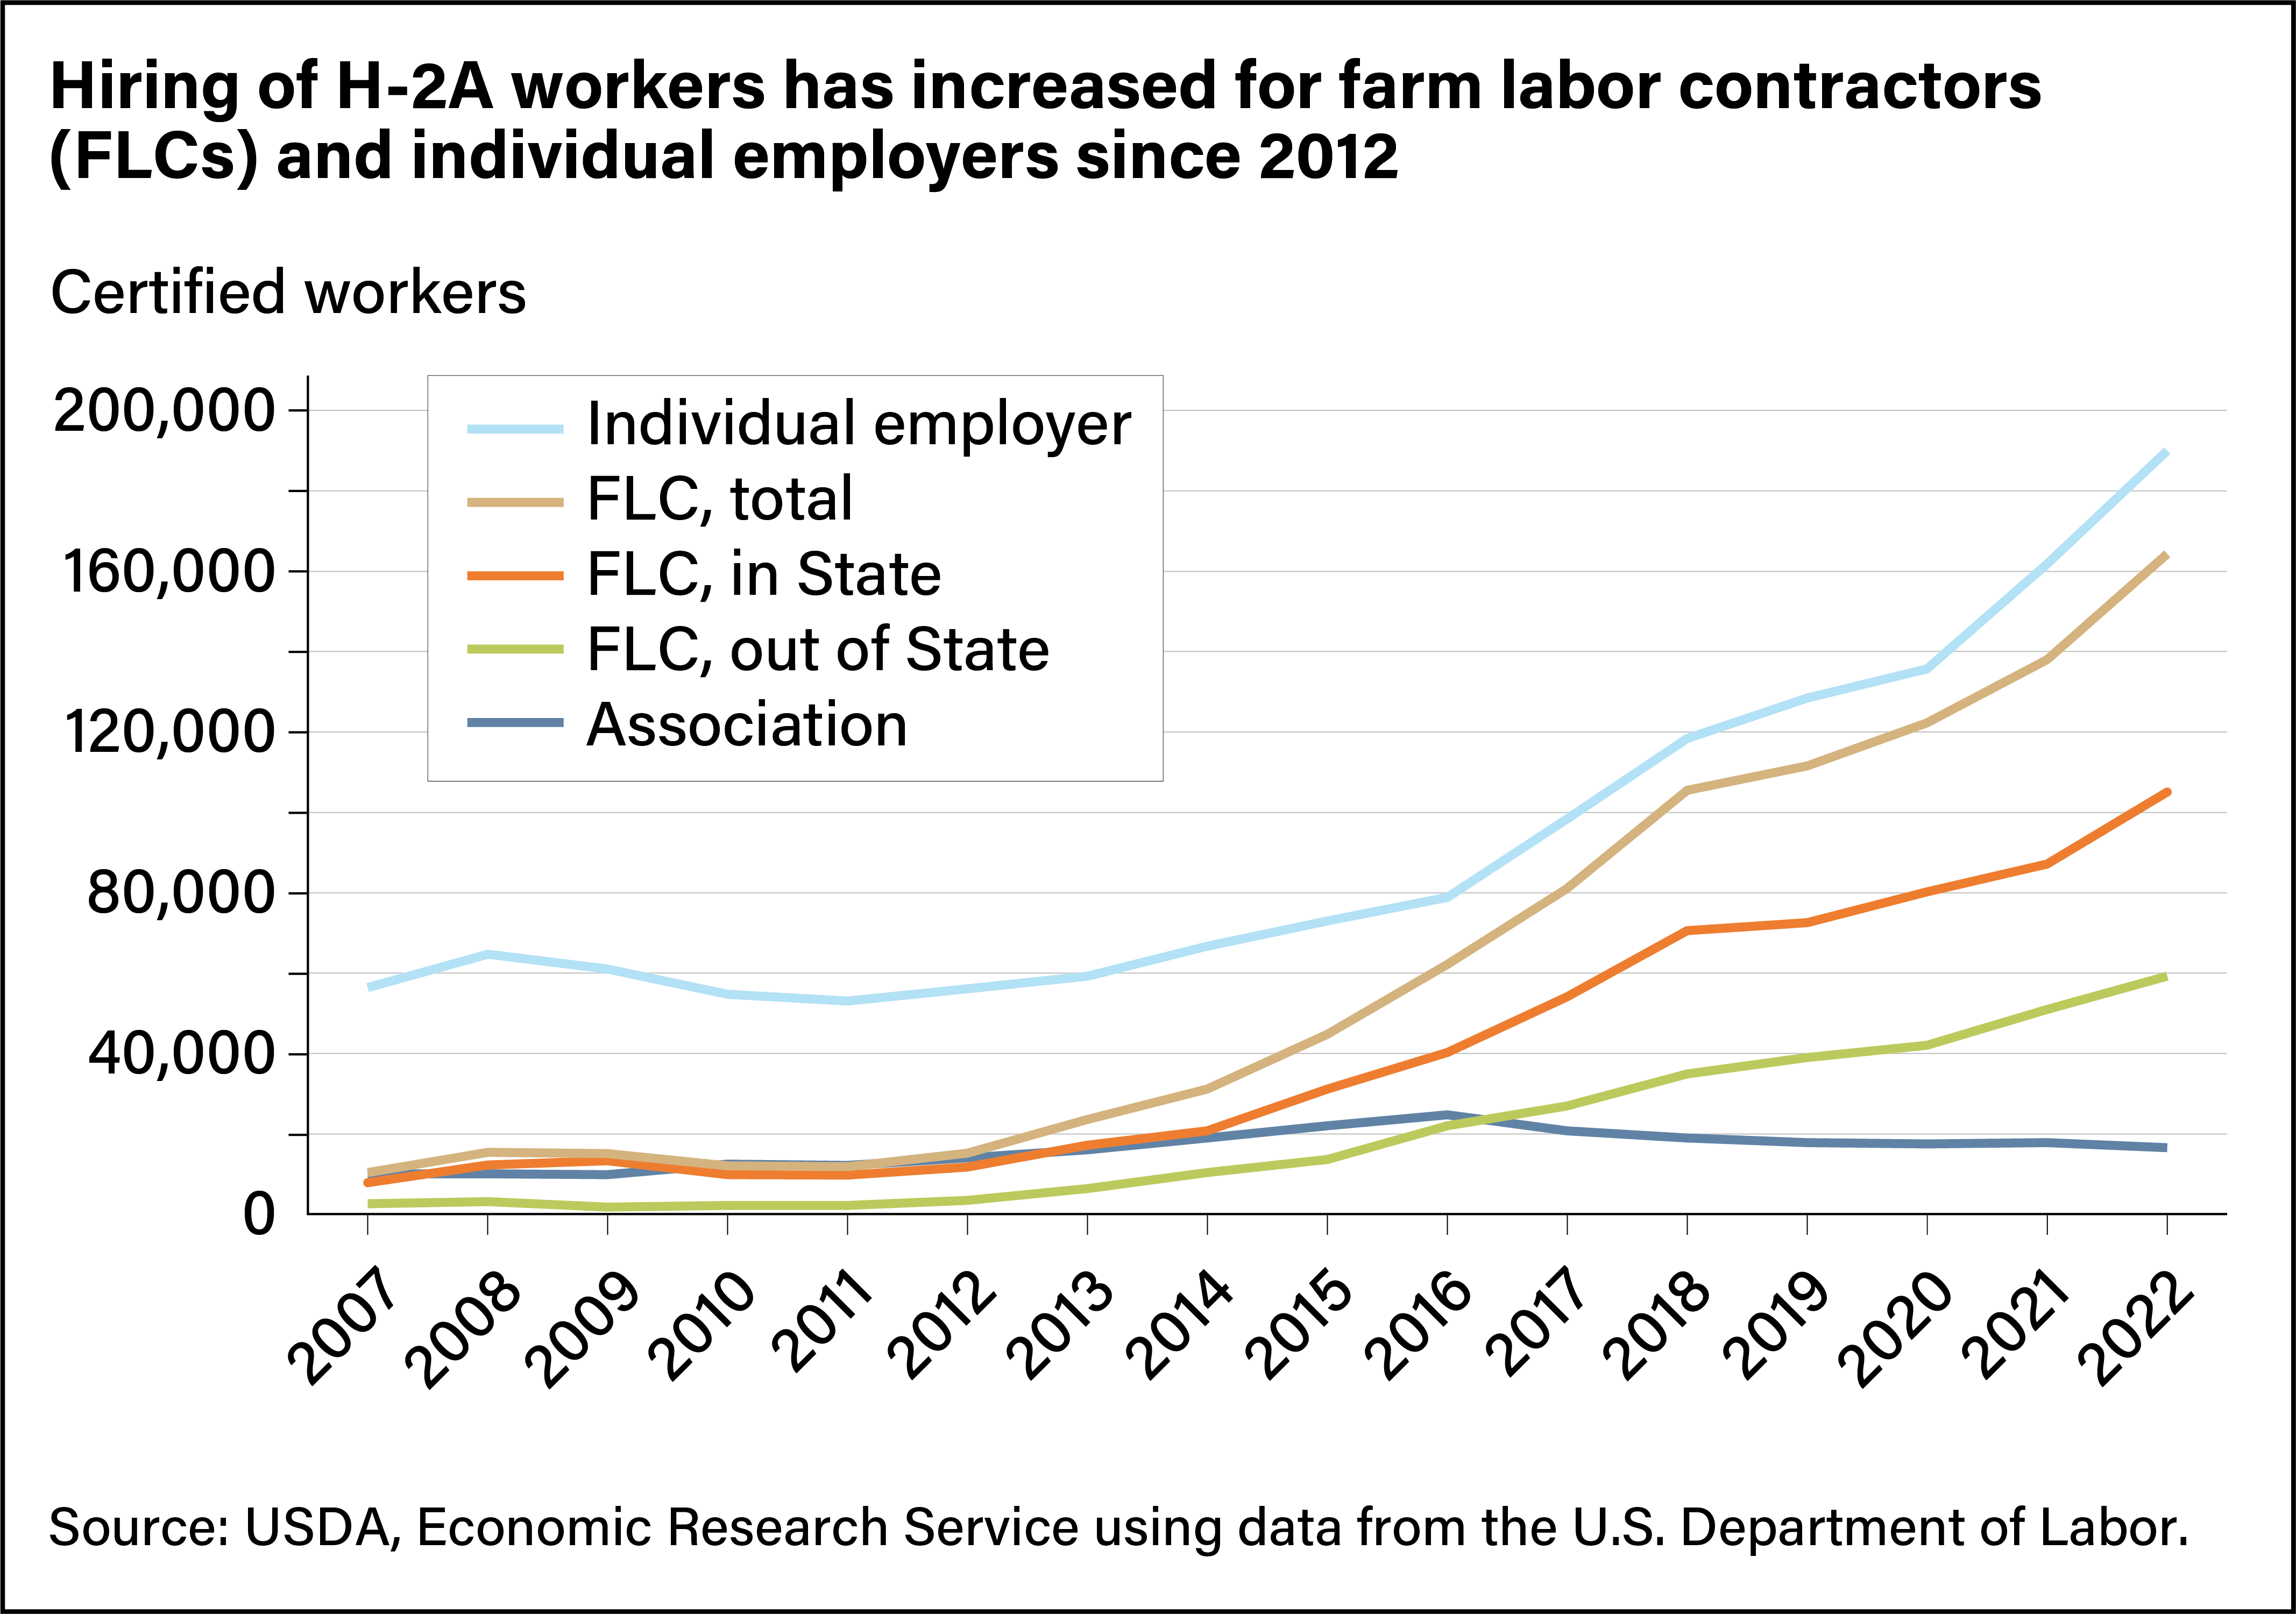
Line chart showing number of individual employers, total farm labor contractors (FLCs), FLCs in State, FLCs out of State, and associations between 2007 and 2022.