How sweet it is: Deliveries of caloric sweeteners for food and beverage use are on the rise
- by Vidalina Abadam
- 2/14/2023

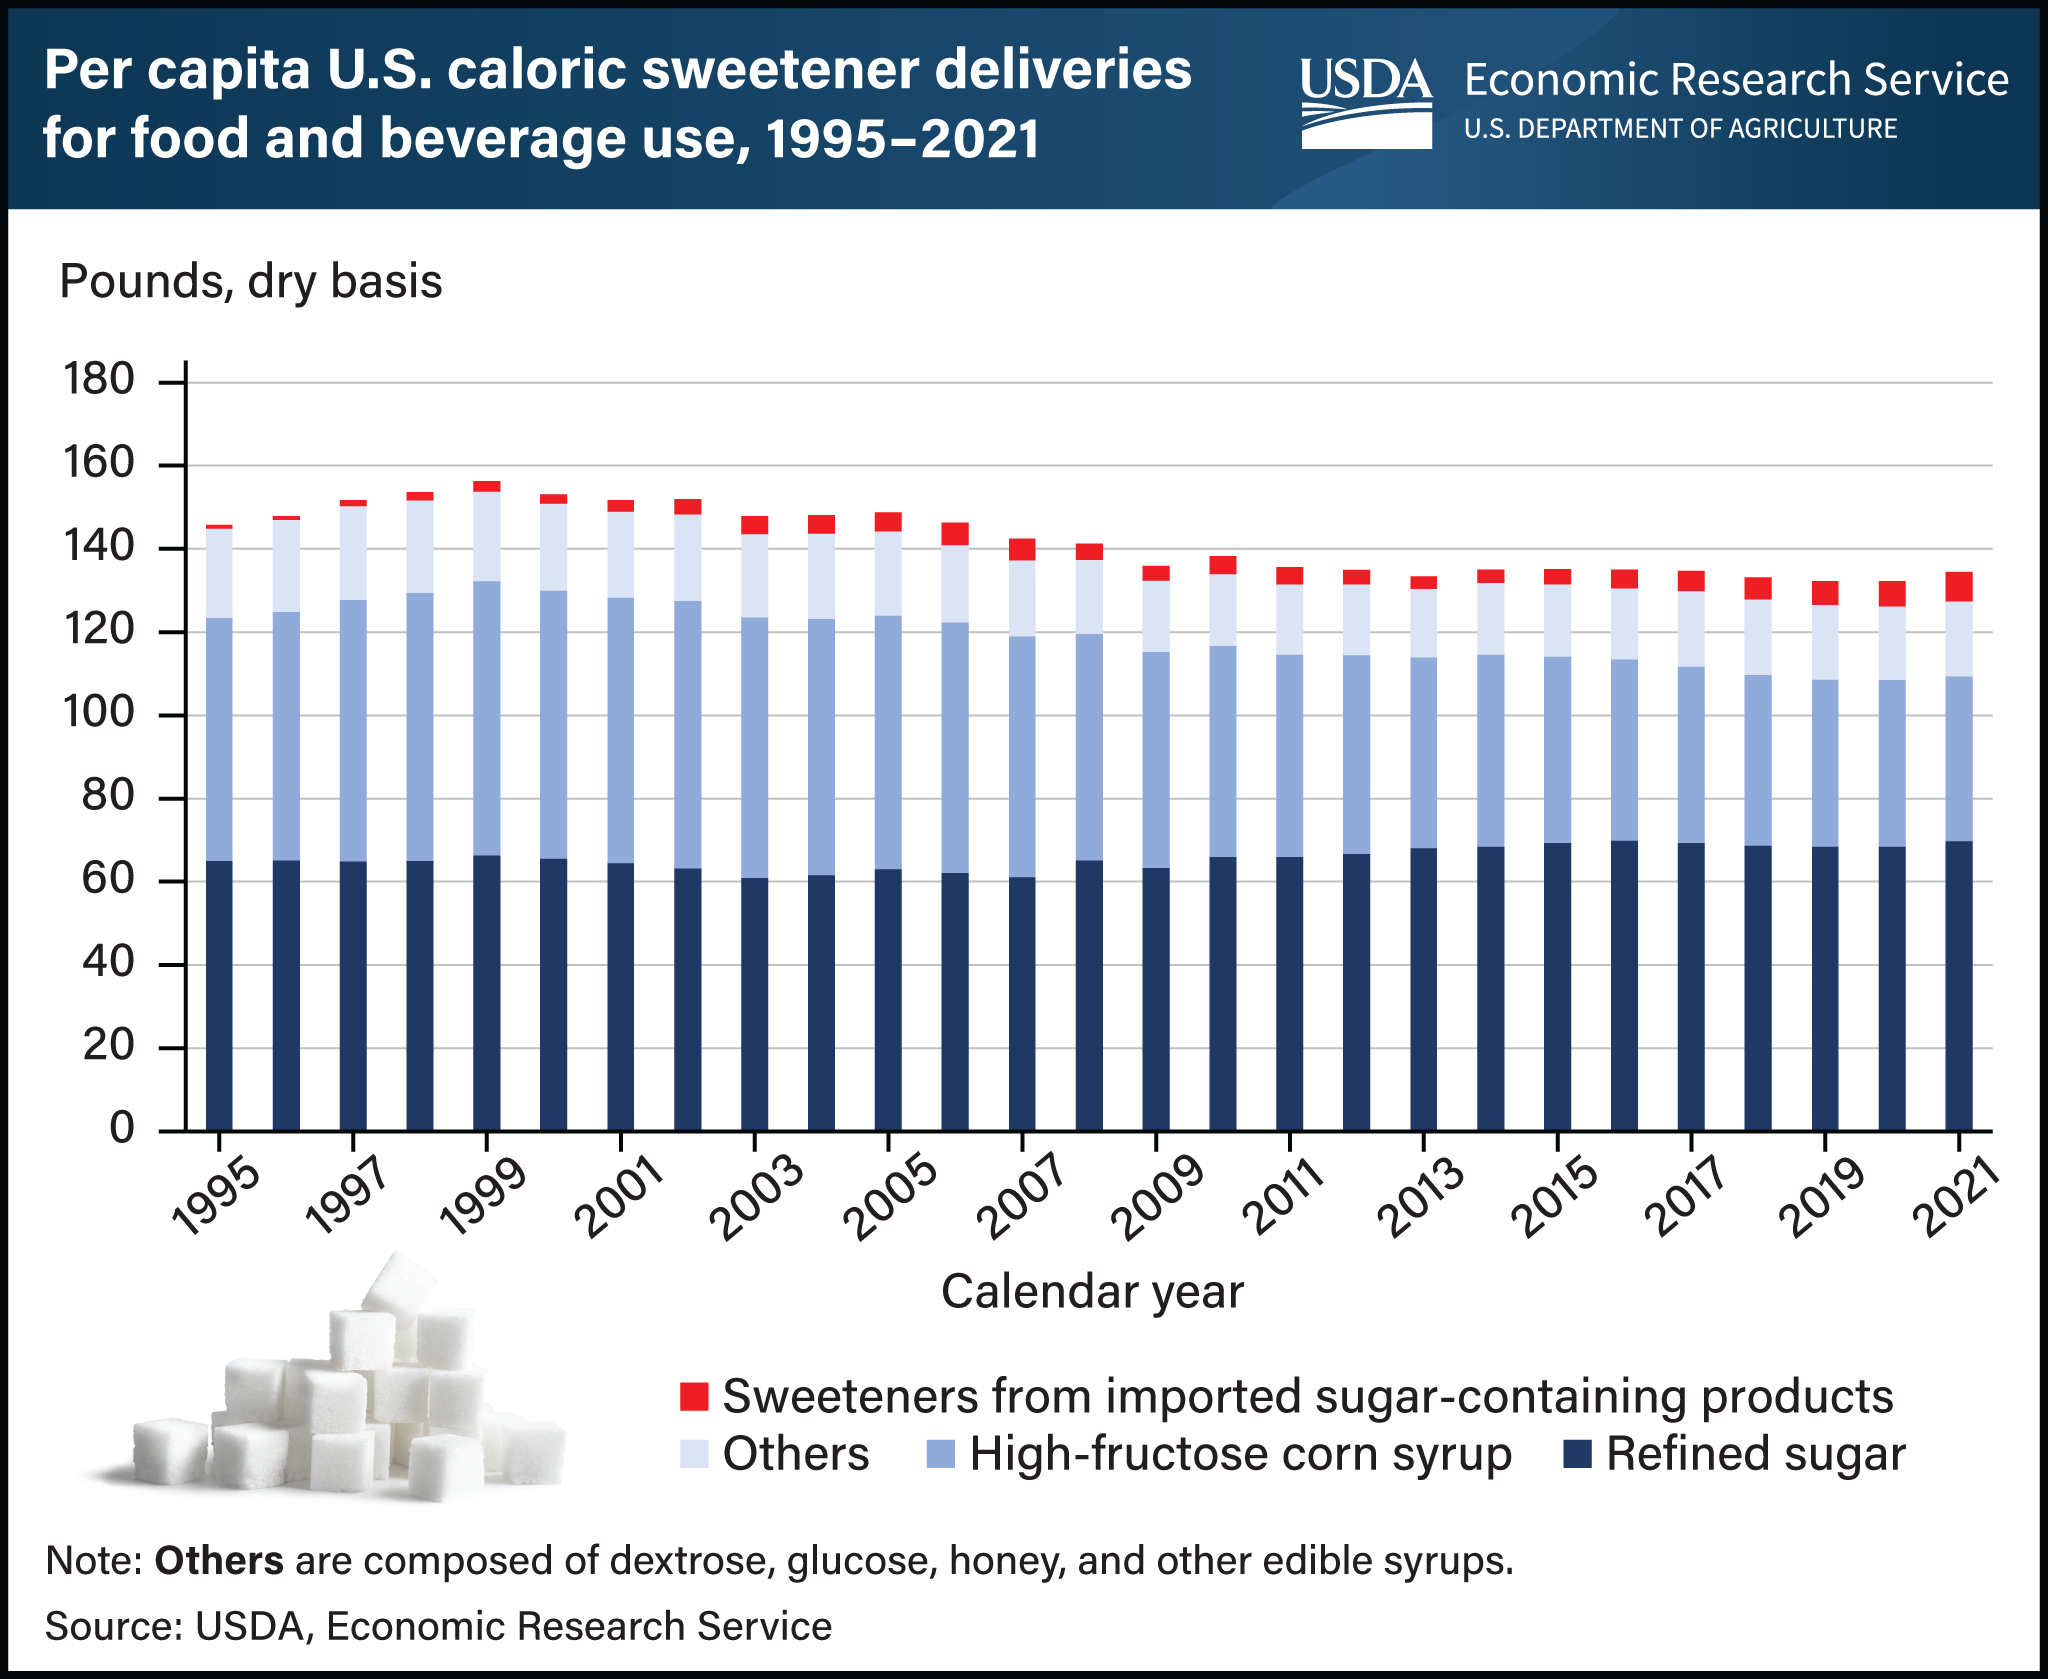
Total caloric sweetener deliveries from domestic producers and importers to end-users and brokers—an indicator of sweetener consumption in the United States—rose by 1 percent in 2021 to 127.4 pounds per capita. Annual growth in per capita sweetener deliveries had not been observed since 2014 amid the backdrop of a long-term declining trend that started after peaking at 153.7 pounds in 1999. Growth in 2021 was driven by an increase in refined sugar deliveries per capita, the largest component, which were up 1.9 percent in 2021 at 69.8 pounds and the highest since 1995. This growth countered the 1.2 percent decrease in per capita high-fructose corn syrup (HFCS) deliveries to 39.5 pounds. HFCS deliveries, the other major component, have been steadily decreasing since topping out at 65.9 pounds in 1999, driving the long-term decline in total sweetener deliveries. While per capita deliveries of other caloric sweeteners (glucose, dextrose, honey, other edible syrups) increased by 2.4 percent in 2021, the volumes have been relatively small, historically hovering at 20 pounds. Some of the sweetened food and beverage products that are consumed in the United States, such as soft drinks, ice creams, or even U.S.-branded chocolates that are manufactured overseas, are imported. The contribution of these imports to per capita sweetener consumption is relatively small compared to domestic sweetener deliveries, but their share and volume have been steadily increasing since 2013, reaching 7.1 pounds per capita in 2021, an increase of 16.4 percent. Including estimated sweeteners from the imported sugar-containing products, per capita sweetener deliveries totaled 134.5 pounds in 2021. More information can be found in two special articles on sweetener deliveries that appeared in the January 2023 Sugar and Sweeteners Outlook, published by USDA, Economic Research Service.

