
Growth of fruit and vegetable budget shares in 2020 indicates shift in U.S. diets
- by Eliana Zeballos and Abigail Okrent
- 1/19/2023
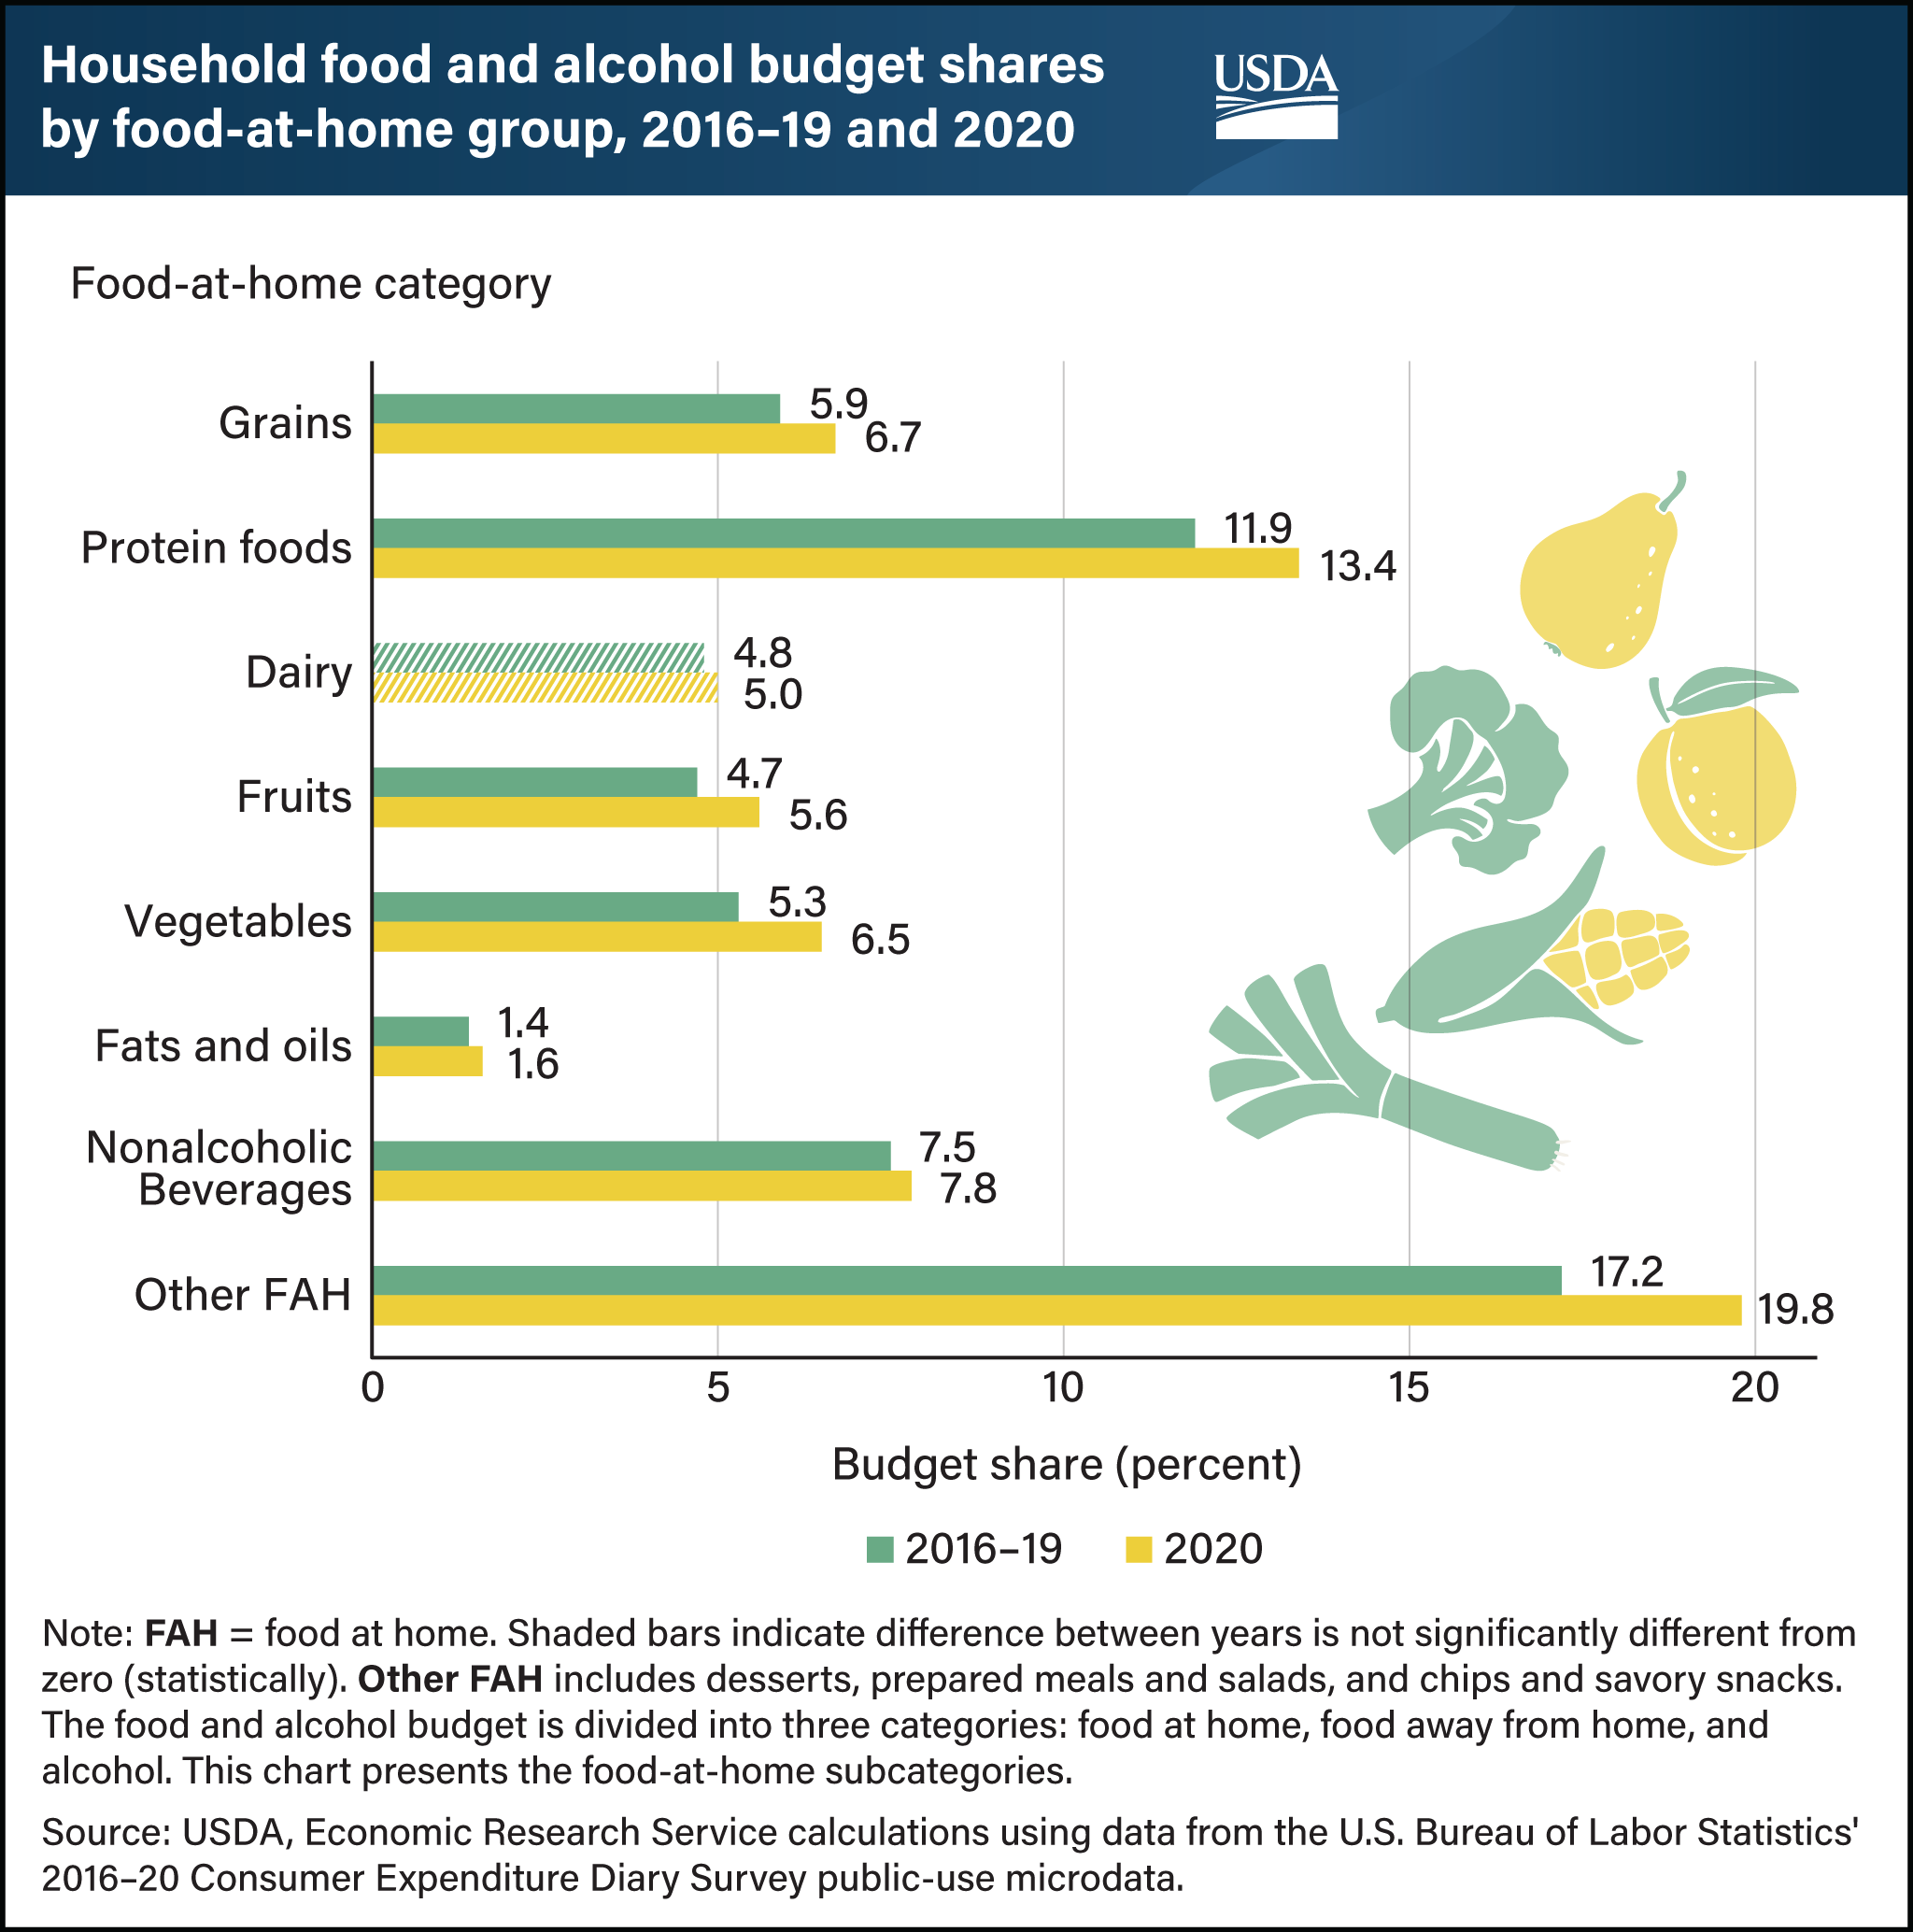
At the beginning of the Coronavirus (COVID-19) pandemic in 2020, U.S. households shifted away from buying foods at restaurants and other food service venues to food-at-home (FAH) outlets such as grocery stores and other retail establishments. Overall, the share of the household food and alcohol budget spent on FAH increased 7.8 percentage points between the pre-pandemic (2016–19) level and 2020. The largest contributions to this change were the “other FAH” category (including desserts, prepared meals and salads, and chips and savory snacks), which increased 2.6 percentage points, and protein foods (red meat, poultry, eggs, and fish and seafood), which increased 1.5 percentage points. Even though those are the subgroups with the largest changes for household food and alcohol spending, the budget shares for fruits and vegetables showed the fastest growth from 2016–19 to 2020. The share of the average household food and alcohol budget spent on vegetables contributed only 1.2 percentage points to the total but increased 23 percent. The share spent on fruits increased 19 percent (from 4.7 to 5.6 percent). Increases in the share spent on grains, nonalcoholic beverages, and fats and oils also contributed to the overall FAH percentage point gain, but their growth during that period was relatively small. The faster growth of the fruit and vegetable shares in the food and alcohol budget indicates a slight shifting of diets to more produce during the first year of the pandemic. This chart was drawn from the USDA, Economic Research Service report COVID-10 Working Paper: Consumer Food Spending Changes During the COVID-19 Pandemic.