
One-third of U.S. food dollar spent on food services in 2021, a record high
- by James Chandler Zachary and Quinton Baker
- 1/10/2023
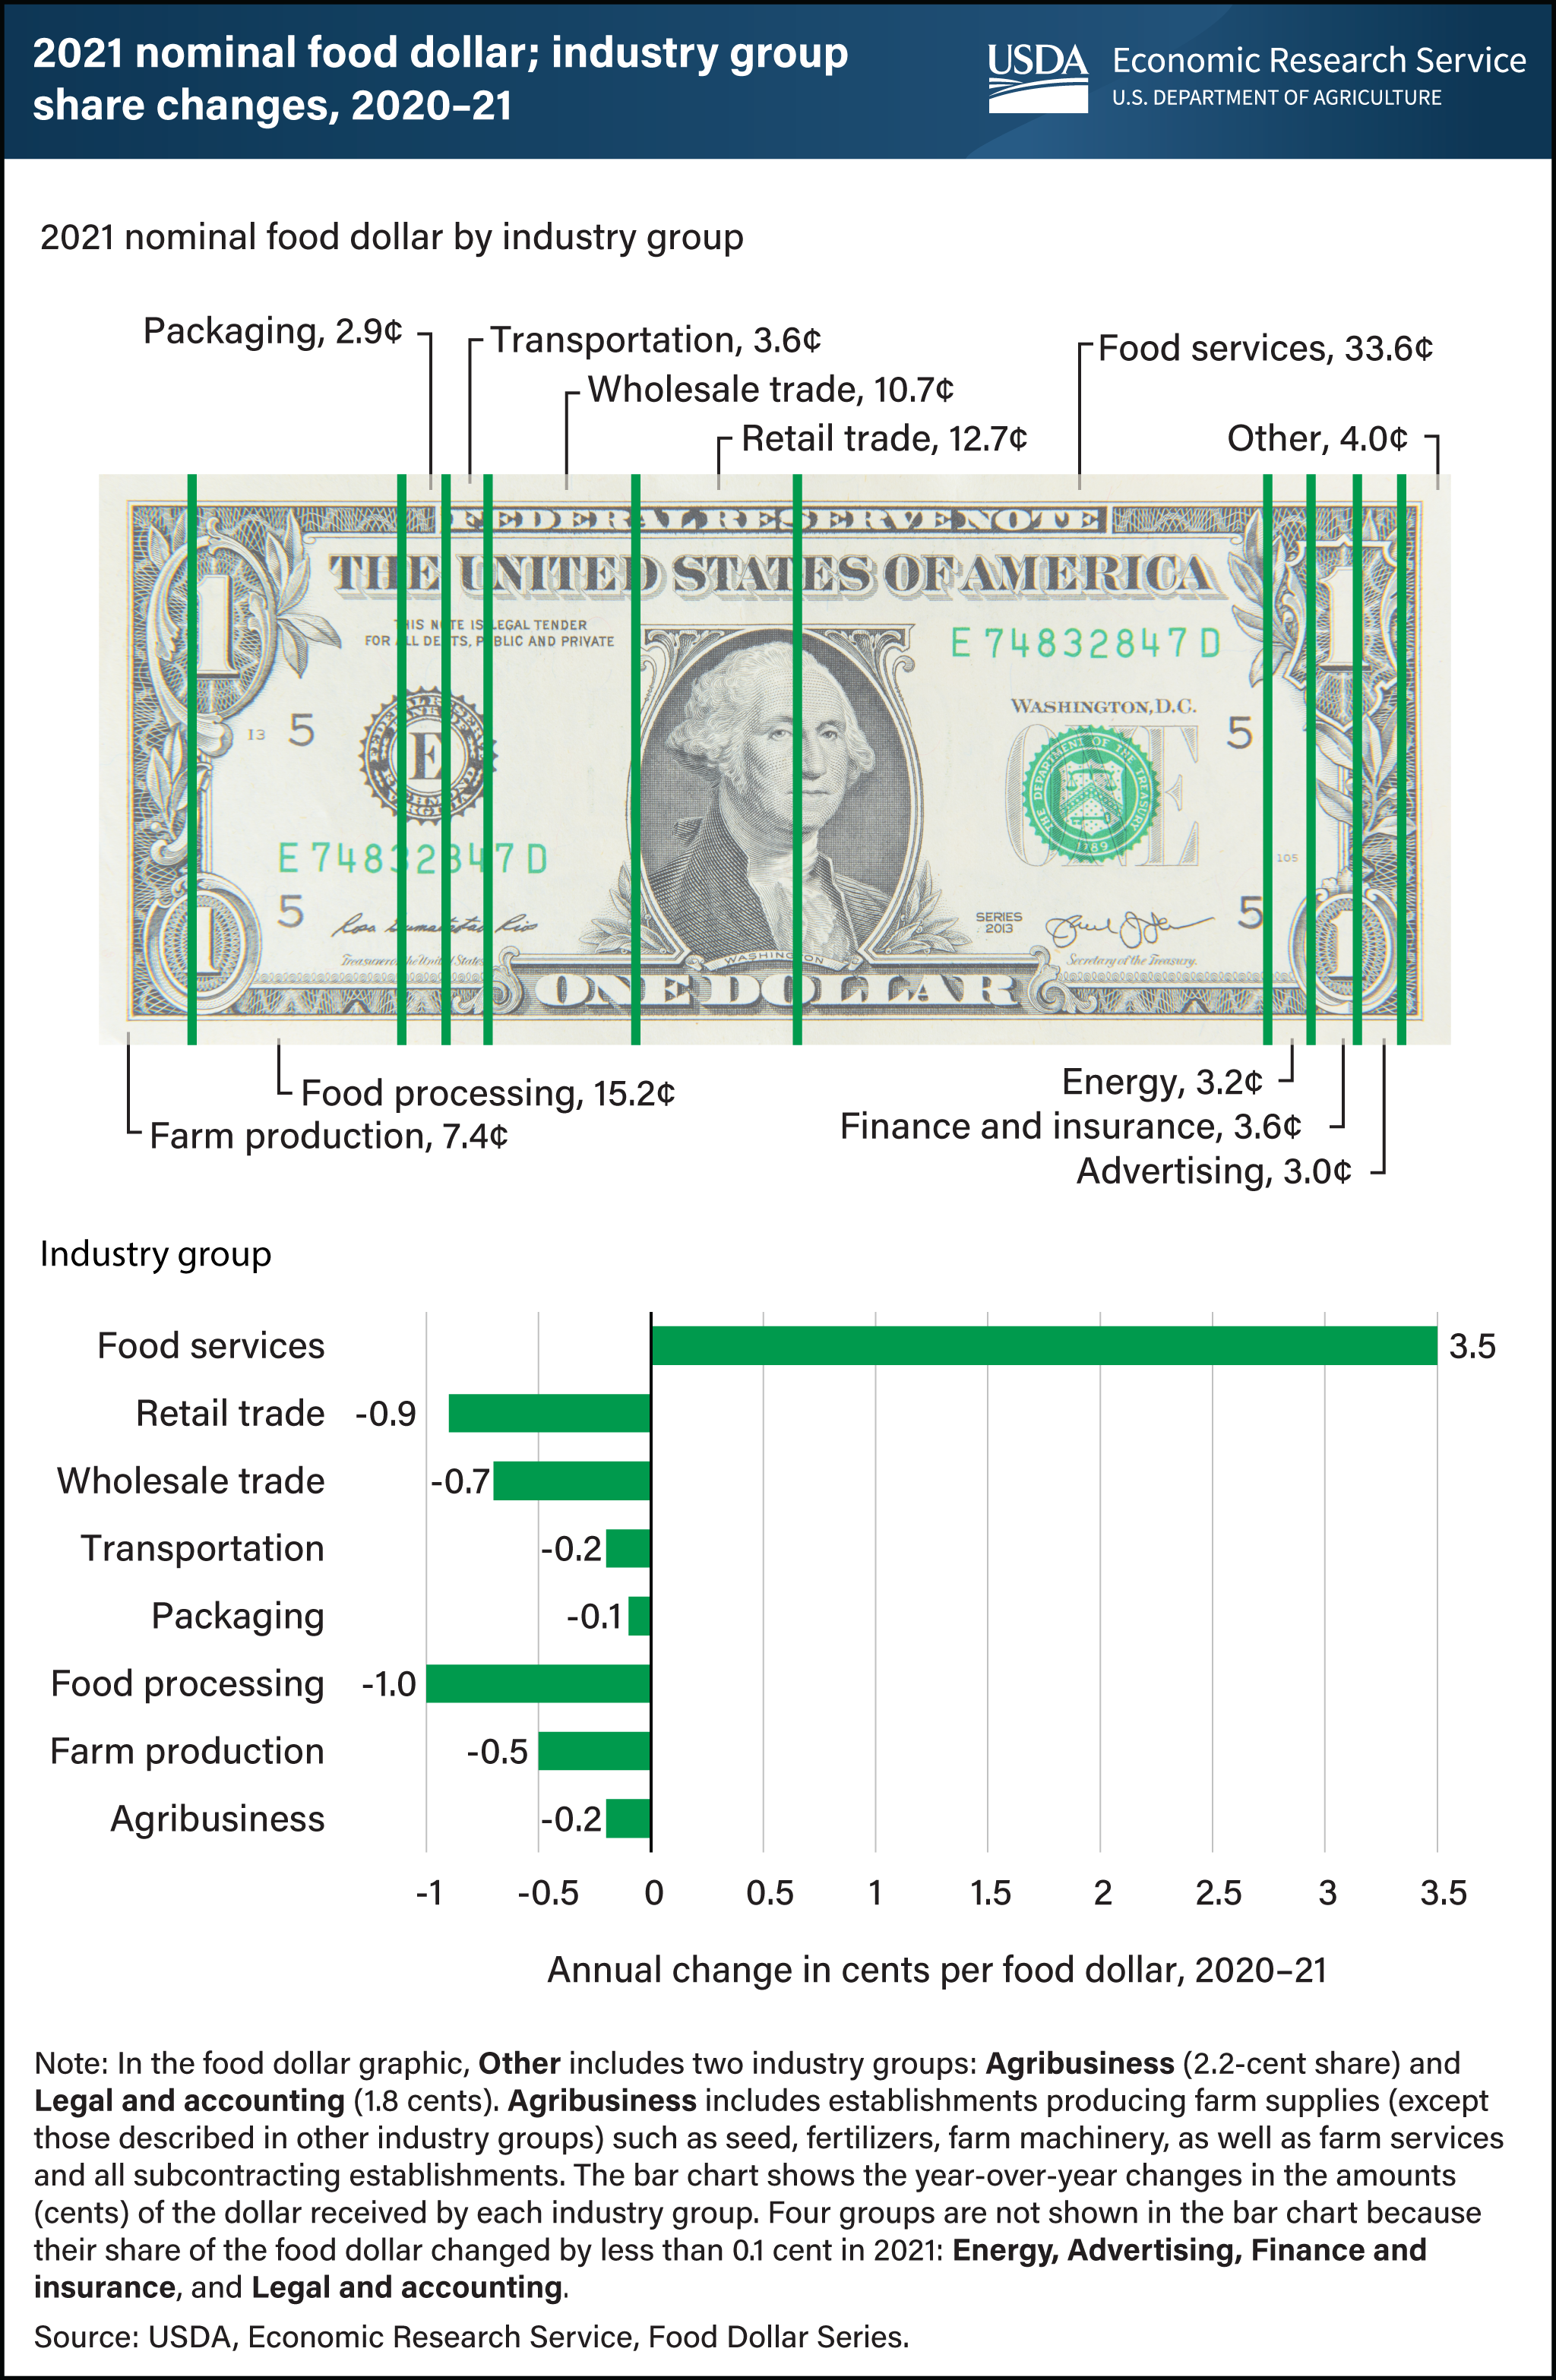
In 2021, 33.6 cents of an average dollar spent on domestically produced food went to foodservice establishments, which include restaurants and other food-away-from-home outlets. At more than one-third of the 2021 food dollar, the foodservice share increased 3.5 cents over 2020 to reach its highest value in the USDA, Economic Research Service’s (ERS) Food Dollar Series. The share for food services does not include expenses paid to other industry groups, such as food, energy, and financial services. The shares for energy, advertising, finance and insurance, and legal and accounting changed less than 0.1 cent from their 2020 values, while the declines among remaining industry group shares ranged from 0.1 cent lower (packaging) to 1.0 cent lower (food processing). Annual shifts in the food dollar shares between industry groups occur for a variety of reasons, including changes in the mix of foods consumers buy, costs of materials, ingredients, and other inputs, as well as changes in the balance of food at home and away from home. The 2021 changes in the industry group shares reflect shifts toward pre-pandemic trends that were interrupted when consumers spent more on food-at-home during the Coronavirus (COVID-19) pandemic. The industry group shares food dollar chart is available for 1993 to 2021 and can be found in ERS’s Food Dollar Series data product, updated November 17, 2022.