
U.S. soybean oil production rises to meet growing domestic demand
- by Aaron M. Ates and Maria Bukowski
- 12/21/2022
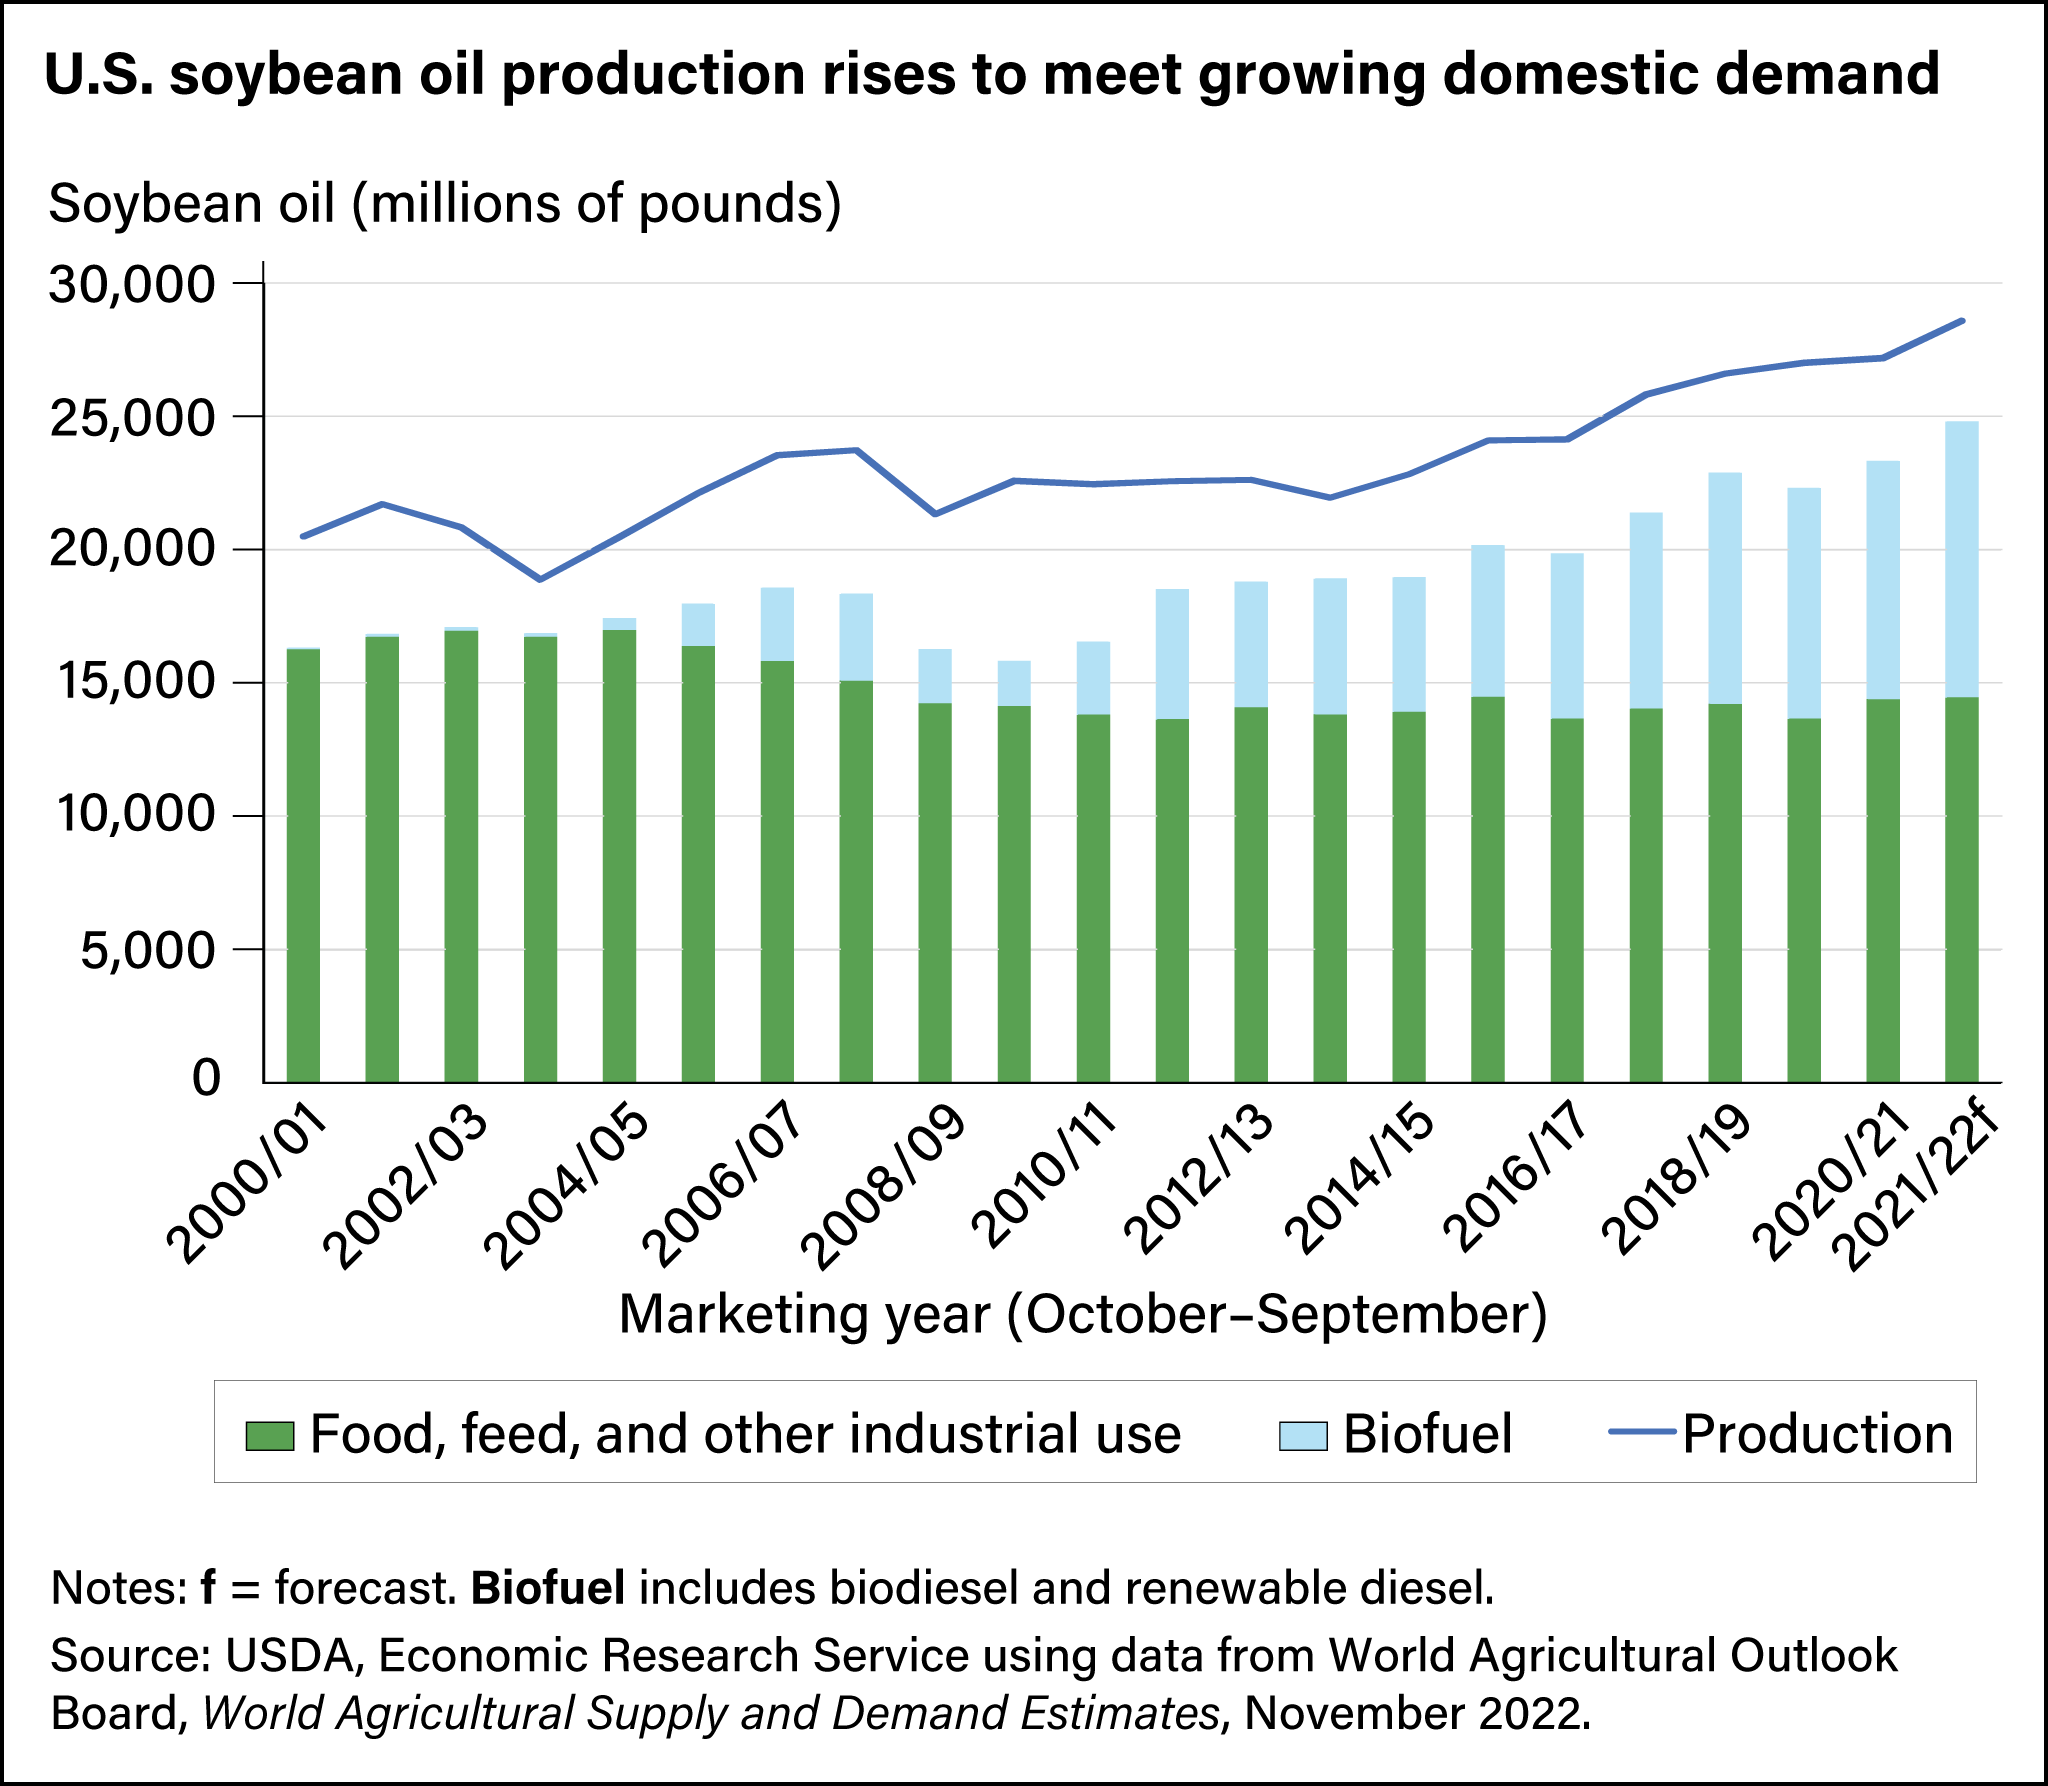
Combination stacked bar chart showing demand for soybean oil by sector with a line showing production from marketing years 2000/01 to 2020/21 with a forecast for 2021/22.