
In Tanzania, rural households consume about the same share and types of processed foods despite distance from city
- by Christine Sauer
- 10/3/2022
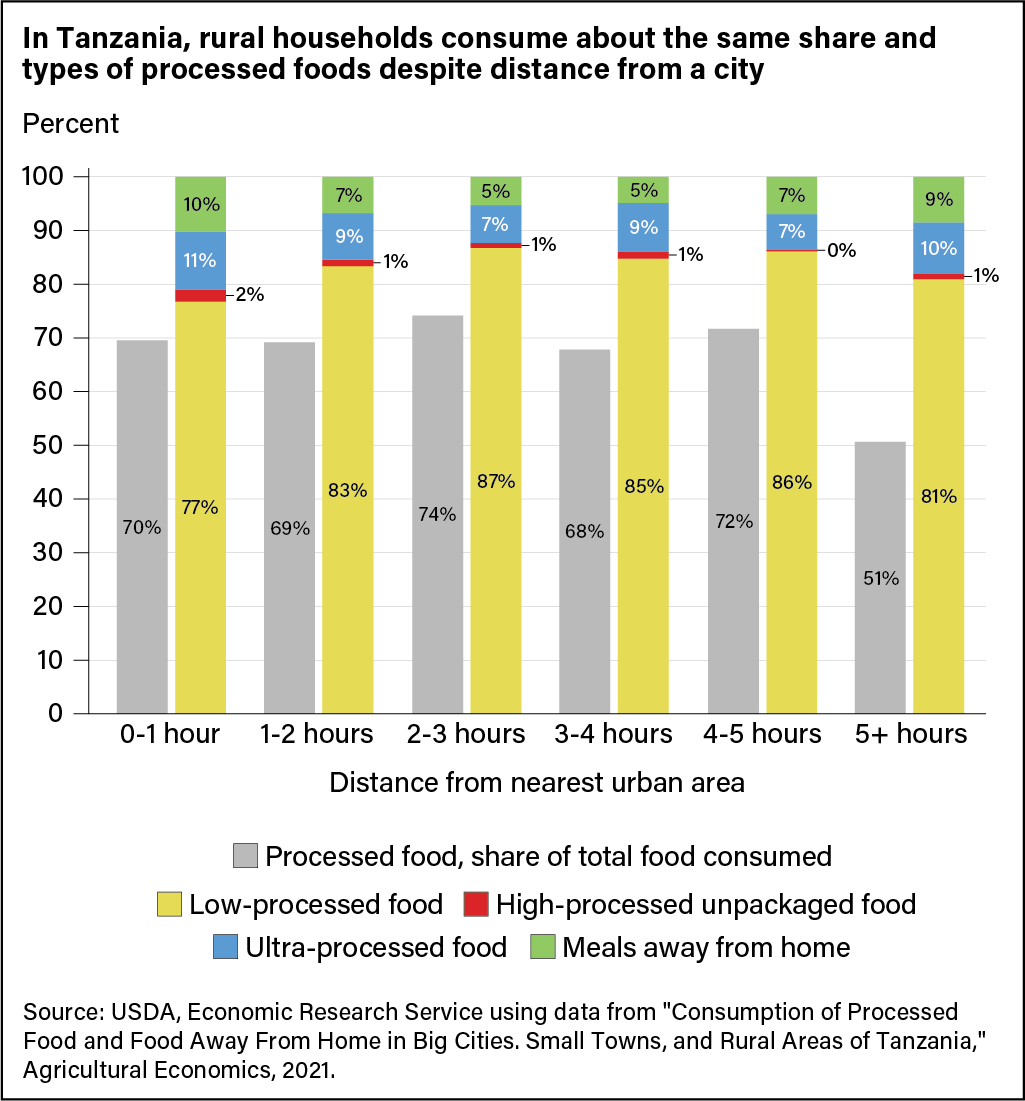
Bar chart showing the percentage of processed food consumed in Tanzania by distance from urban area, by levels of processing (low, high, or ultra), and by meals eaten away from home.