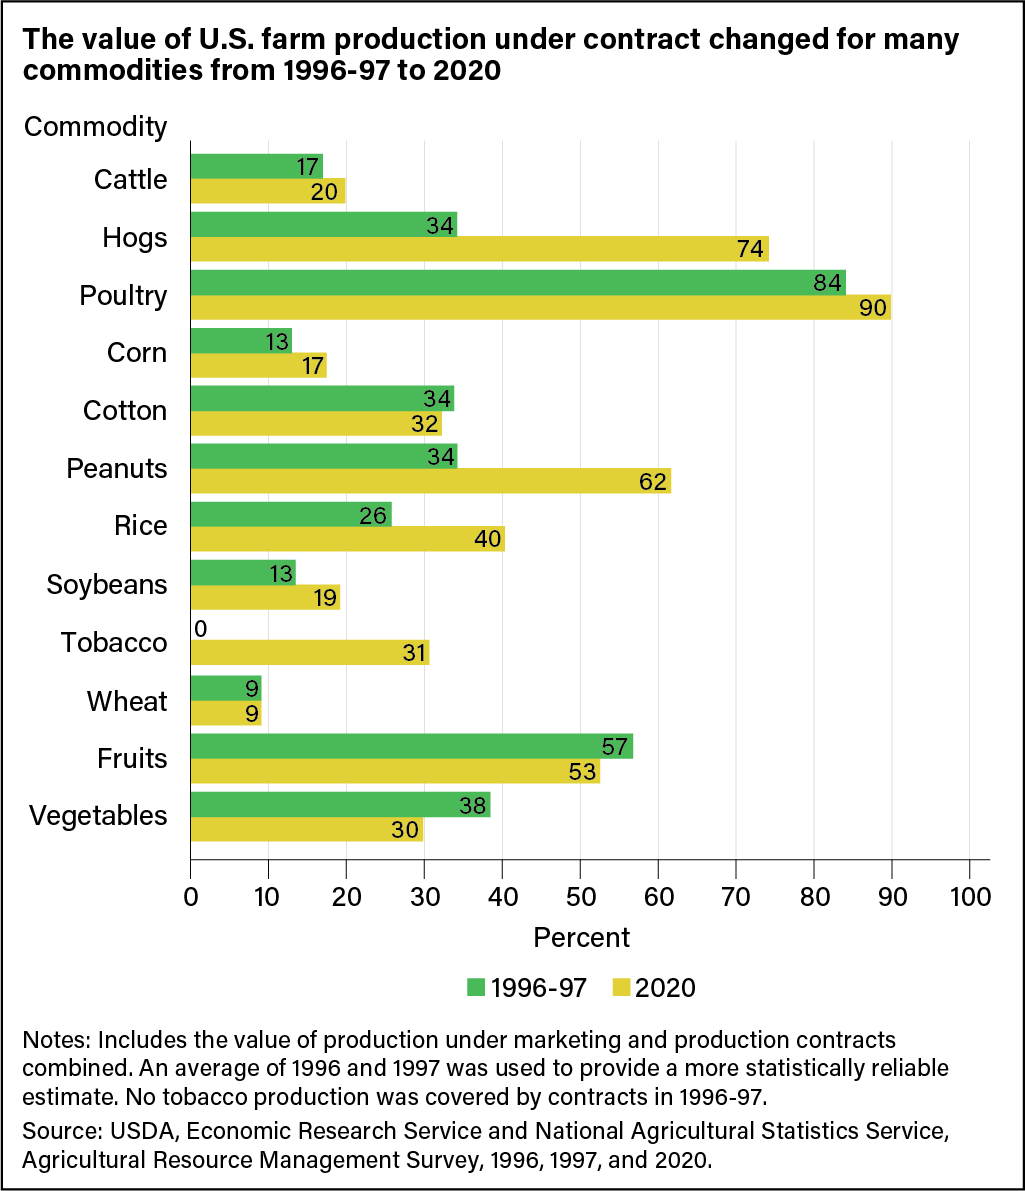
The value of U.S. farm production under contract changed for many commodities from 1996–97 to 2020
- by Christine Whitt
- 6/23/2022

Bar chart indicating the percent of various agricultural commodities under contract in 1996–97 and 2020.
