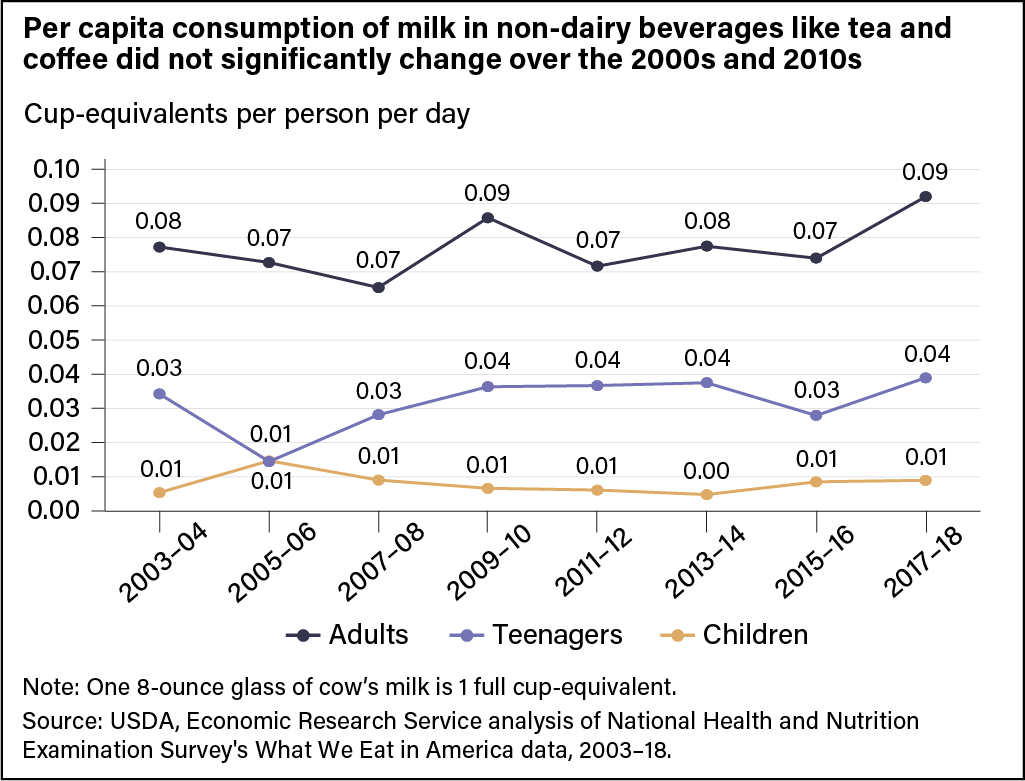
Per capita consumption of milk in non-dairy beverages like tea and coffee did not significantly change over the 2000s and 2010s
- by Hayden Stewart and Fred Kuchler
- 6/21/2022

Line chart showing per capita consumption of milk in non-dairy beverages by adults, teenagers, and children from 2003-04 to 2017-18.
