
Property income’s share of the food dollar reached 20-year high in 2020
- by James Chandler Zachary and Quinton Baker
- 5/16/2022
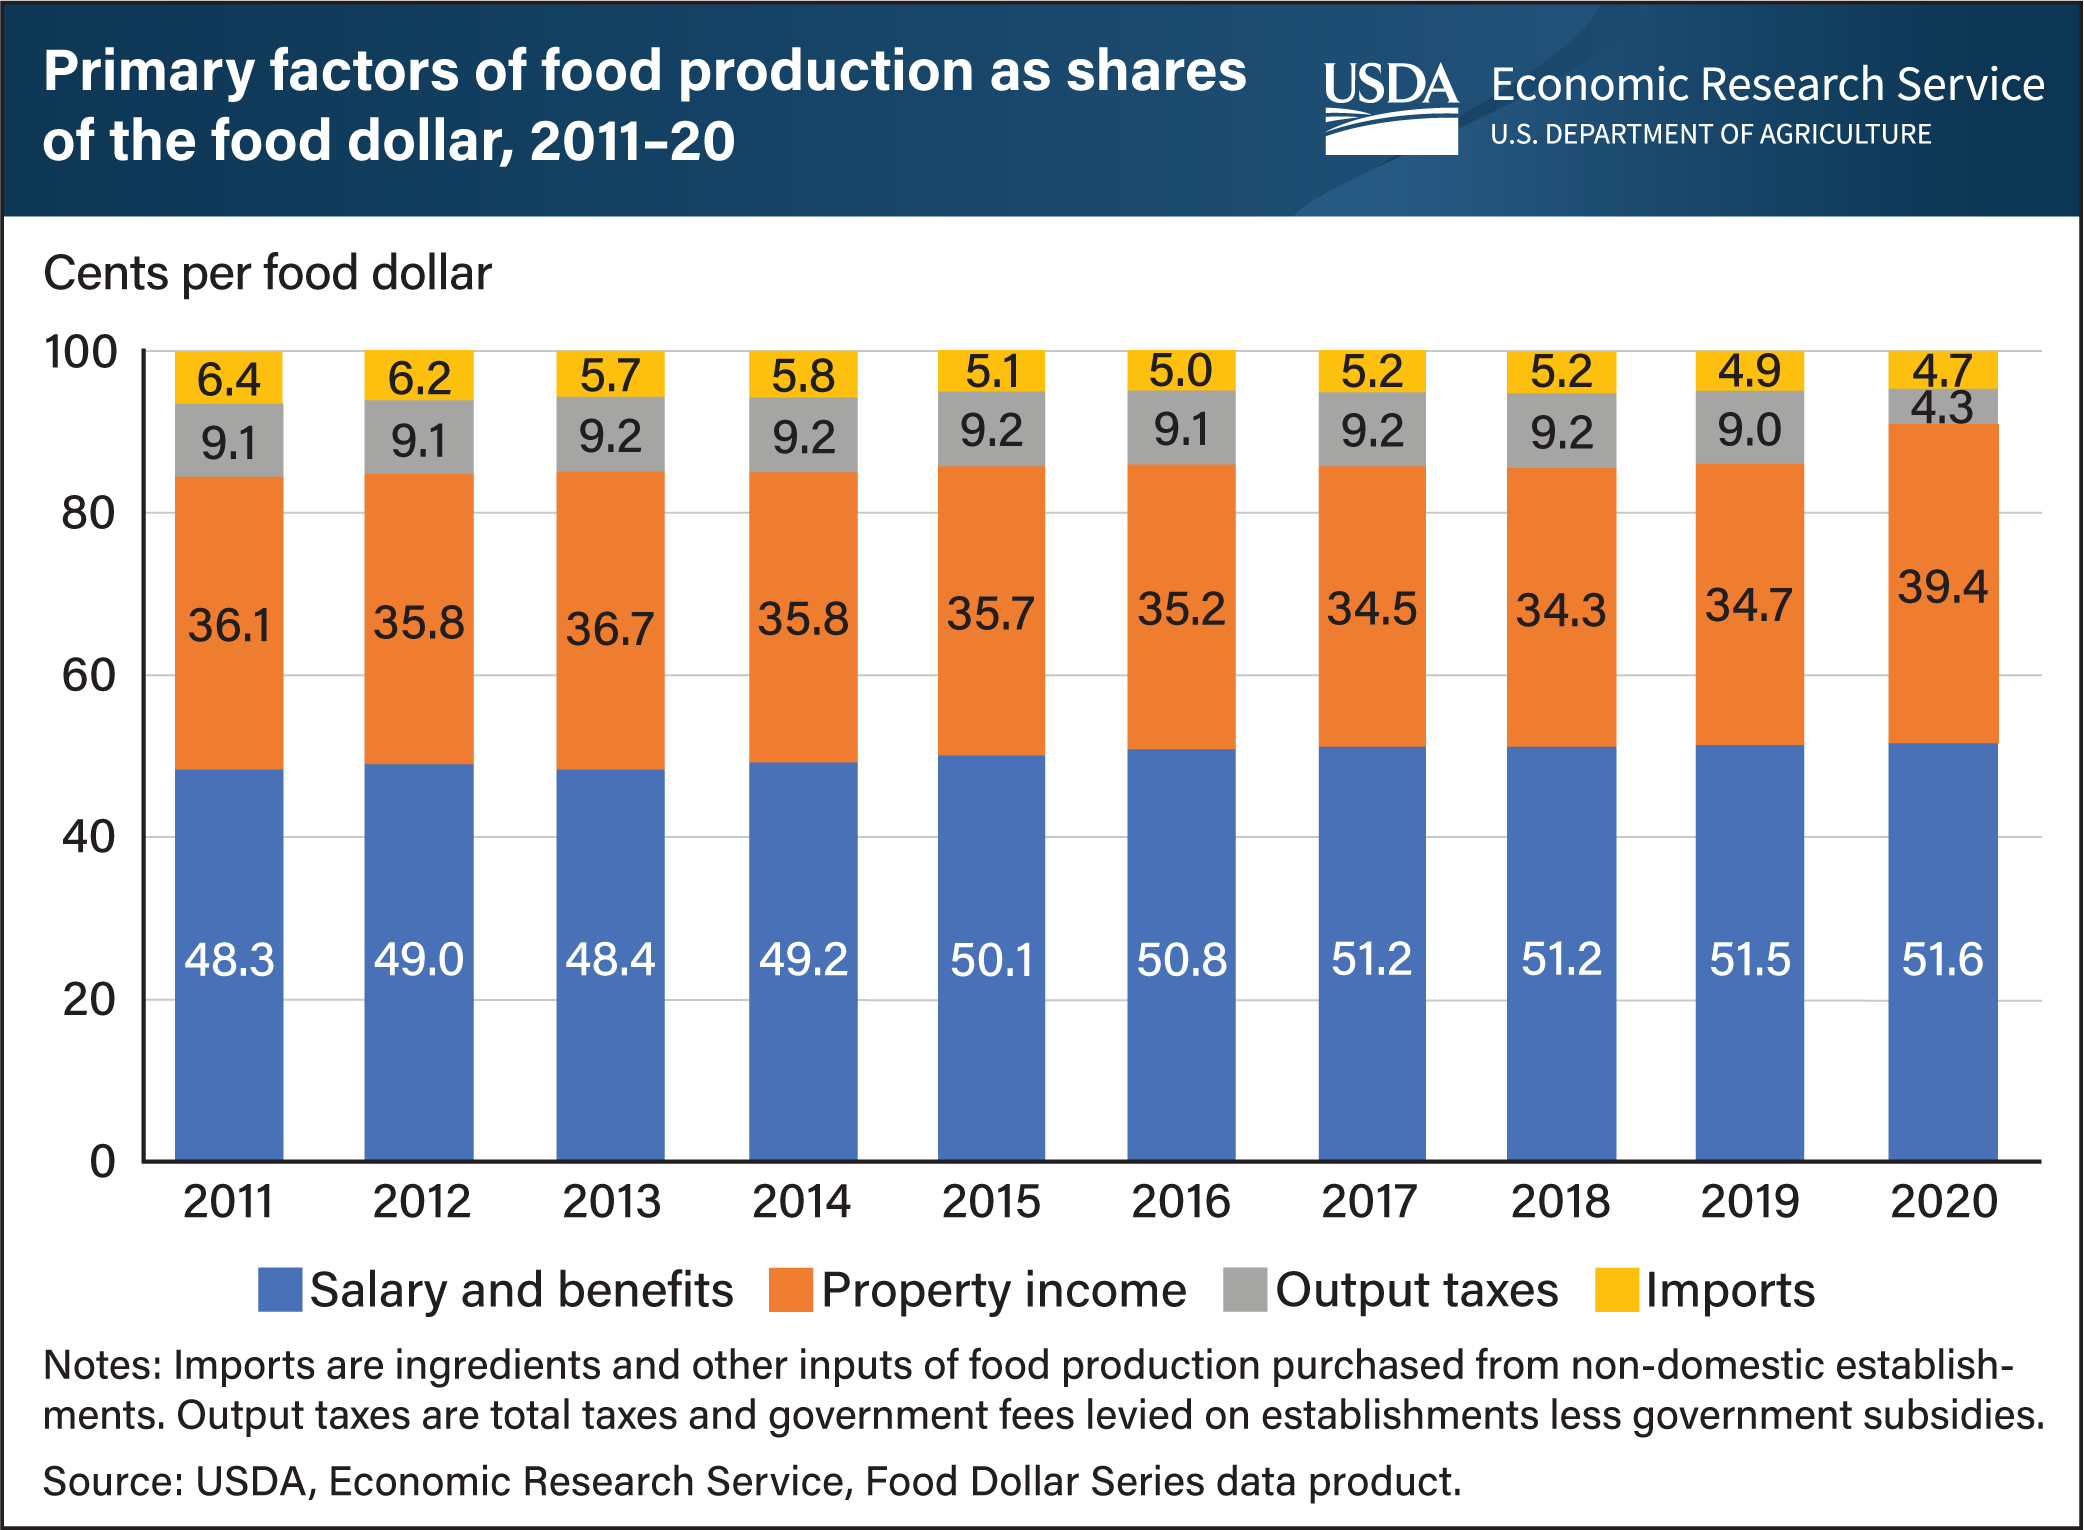
In 2020, the average dollar spent by U.S. consumers on domestically produced food – called the food dollar – returned 39.4 cents as property income, which is income received by owners of capital assets (e.g. land, equipment, and patents) after paying for other intermediate inputs, labor, and output taxes. This 13.5-percent increase from 2019 brought property income’s share of the food dollar to the highest level since 1997. Conversely, the proportion of output taxes, or total taxes and government fees less subsidies, dropped by more than half from 2019 to 4.3 cents of the 2020 food dollar. This reflects increased agricultural subsidies as well as other government policies that affected taxes in 2020. Of the remaining food dollar, 51.6 cents compensated labor for wages and benefits while 4.7 cents went to imported ingredients and inputs. USDA, Economic Research Service’s (ERS) annual Food Dollar Series provides insight into the industries that make up the U.S. food system and their contributions to total U.S. spending on domestically produced food. Annual shifts in the food dollar shares between primary factors occur for a variety of reasons, including changes in the mix of foods consumers buy, the balance of food consumed at home and away from home, and changes in primary factor markets for non-food production. The data for this chart are available for the years 1997 to 2020 and can be found in ERS’s Food Dollar Series data product, updated on March 17, 2022.