
Imports play dominant role as U.S. demand for avocados climbs
- by Catharine Weber and Jaclyn Kramer
- 5/2/2022
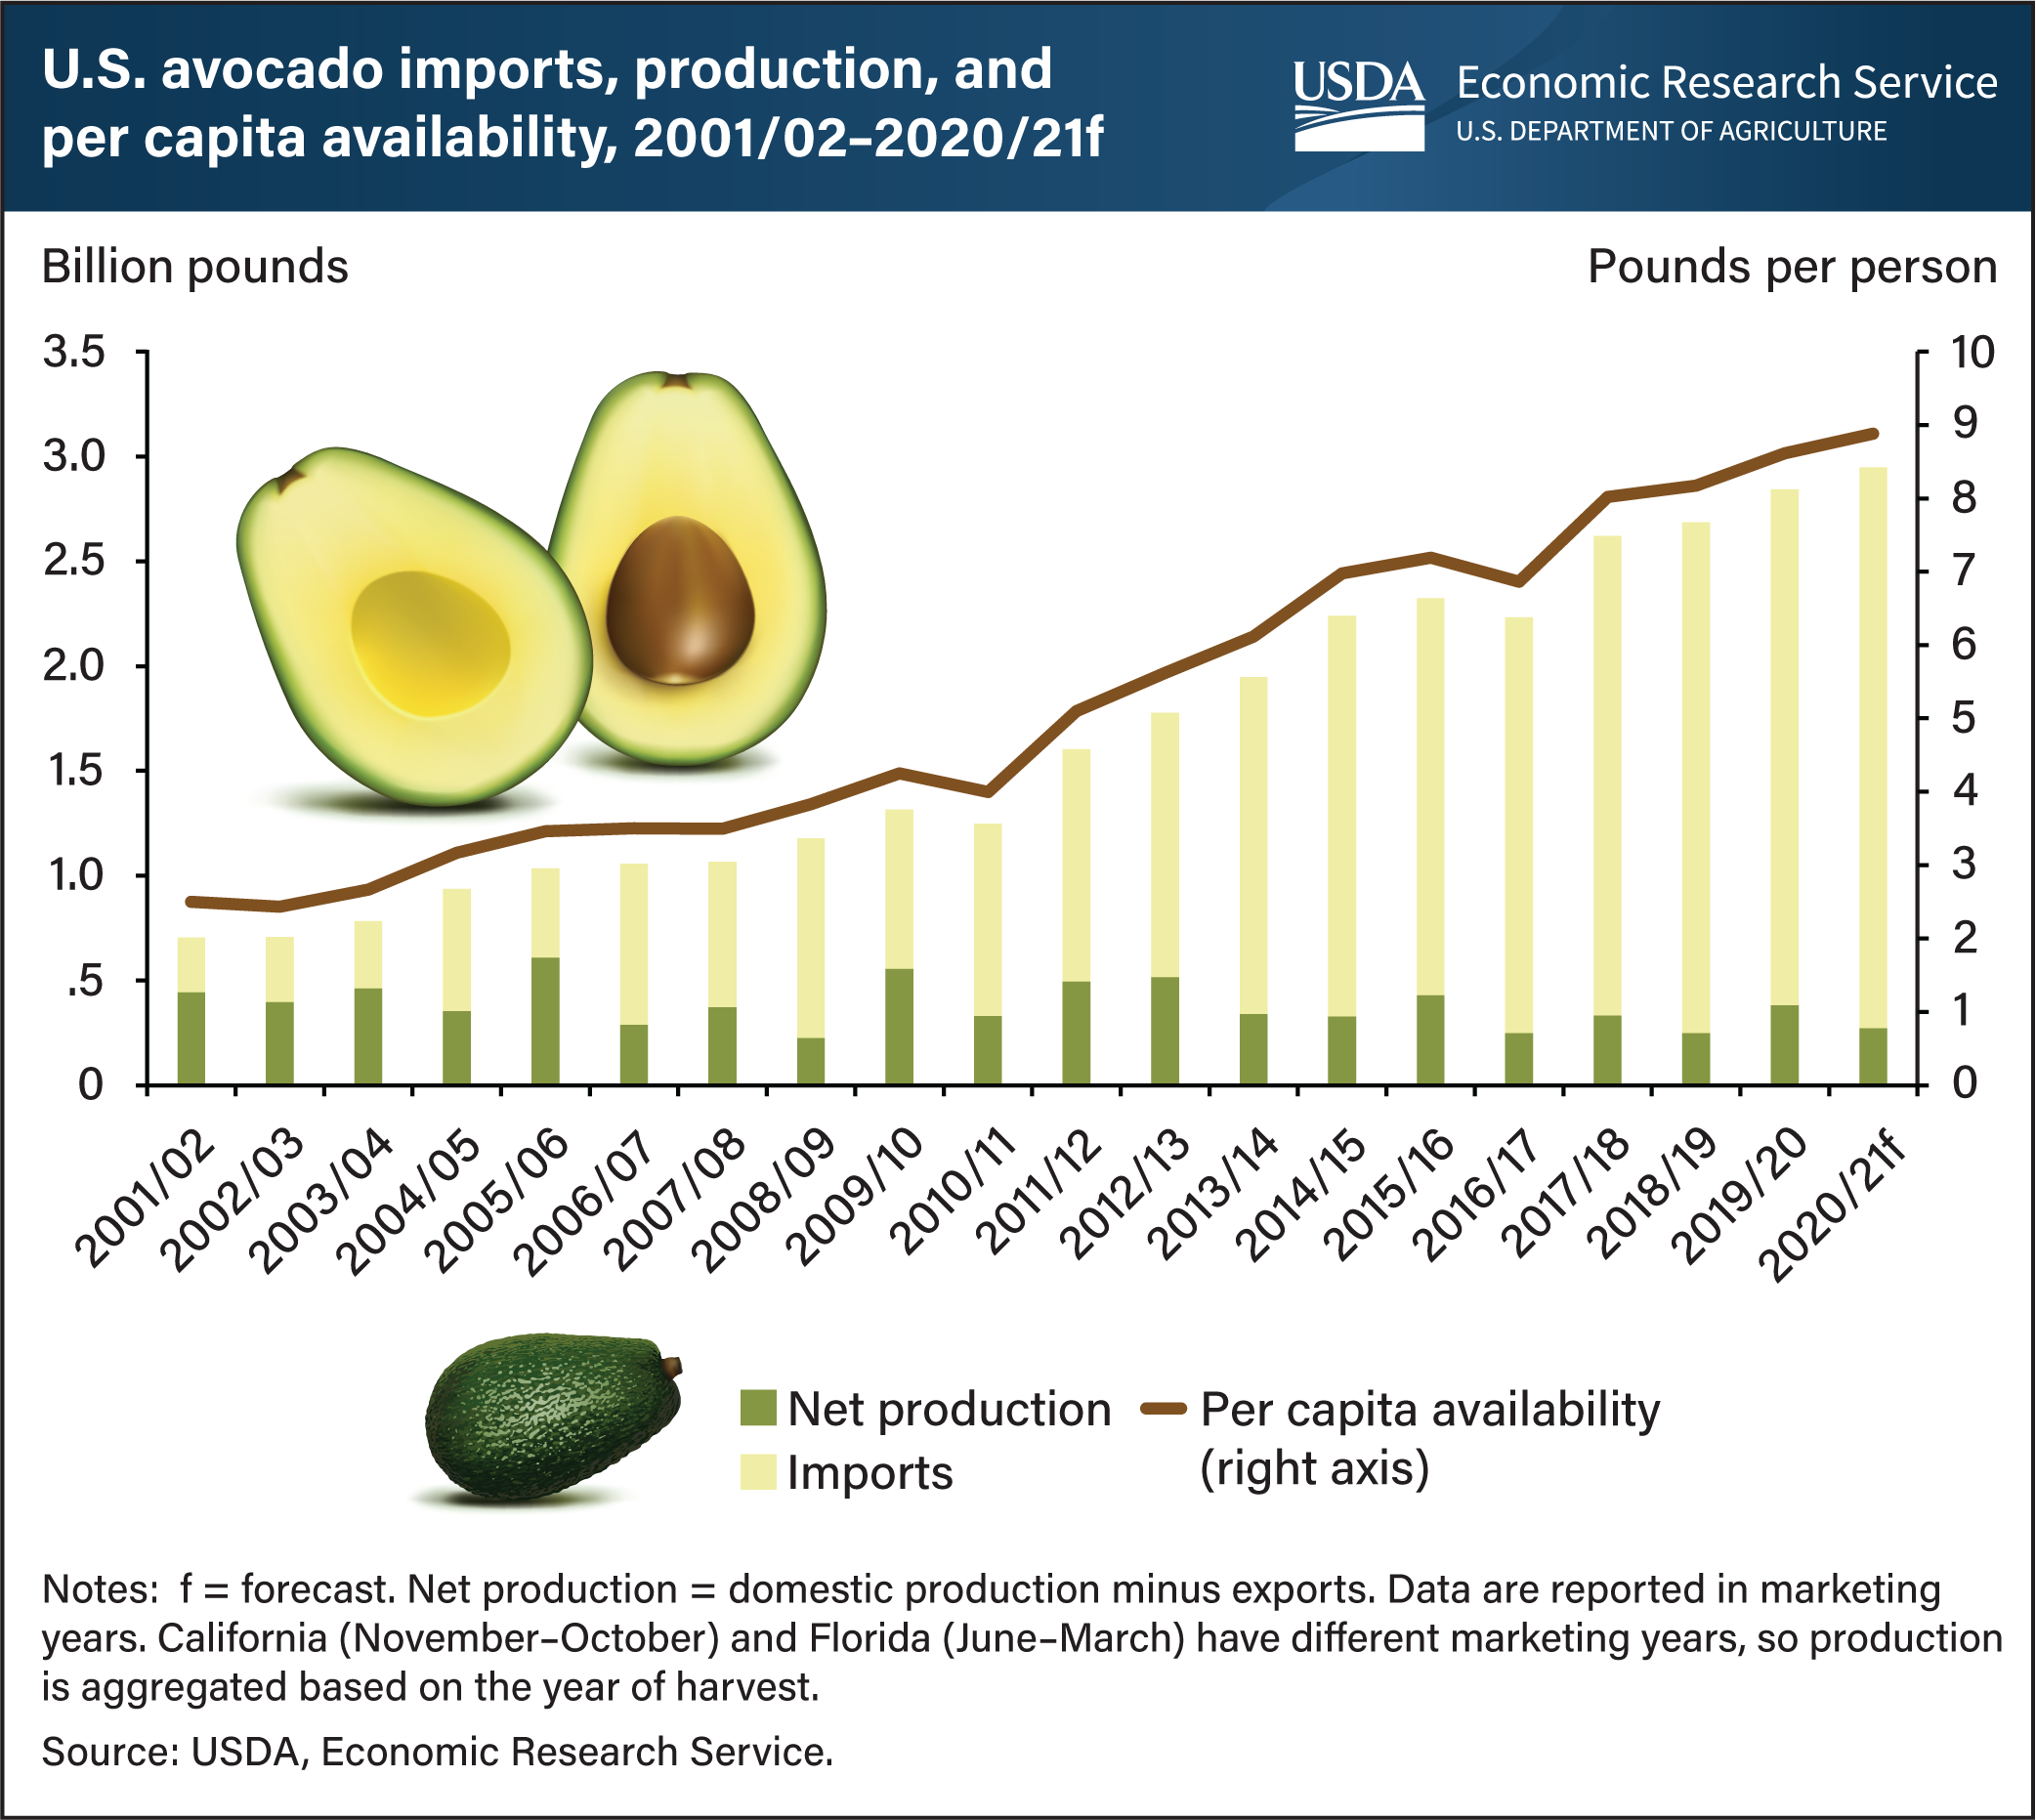
U.S. consumers’ fondness for avocados has taken off since the early 2000s. From 2000 to 2021, the quantity of avocados available per person, a proxy for consumption, tripled to more than 8 pounds per person. The United States has produced an average of about 400 million pounds of avocados each year since 2000, but production has slowly declined since 2011 with a decline in U.S. avocado acreage. Imports have risen to support year-round demand. Imported avocados now account for 90 percent of the domestic supply compared with 40 percent in the early 2000s. In the 2020/21 marketing year, U.S. avocado imports reached a record high of 2.675 billion pounds. Mexico is the leading global producer of avocados, and the United States is the main destination for Mexico’s avocado exports. The United States imported an annual average of 2.25 billion pounds from Mexico in 2019–21 compared with 55 million pounds in 2001–03. From 2019–21, 88 percent of all shipments came from Mexico, while 7 percent came from Peru, 3 percent from the Dominican Republic, and 1 percent from Chile. This chart appears in the USDA, Economic Research Service’s Fruit and Tree Nuts Outlook, March 2022.