
A 1-percent increase in off-farm income leads to increases in debt and investment in land and equipment
- by Nigel Key
- 4/4/2022
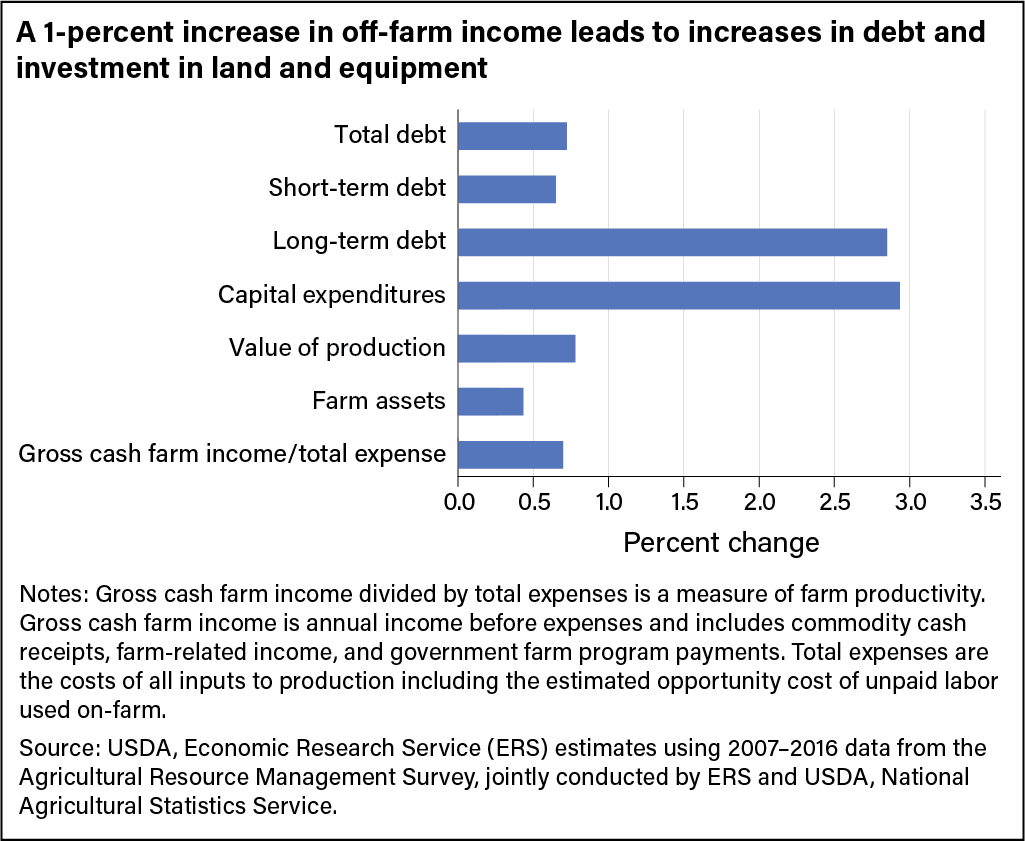
Horizontal bar chart showing effect of off-farm income on total debt, short-term debt, long-term debt, capital expenditures, value of production, farm assets, and gross cash farm income/total expense from 2007-2016.