
Farm share of U.S. food dollar rose one cent in 2020, largest increase in nearly a decade, as food-at-home spending increased
- by Quinton Baker and James Chandler Zachary
- 3/21/2022
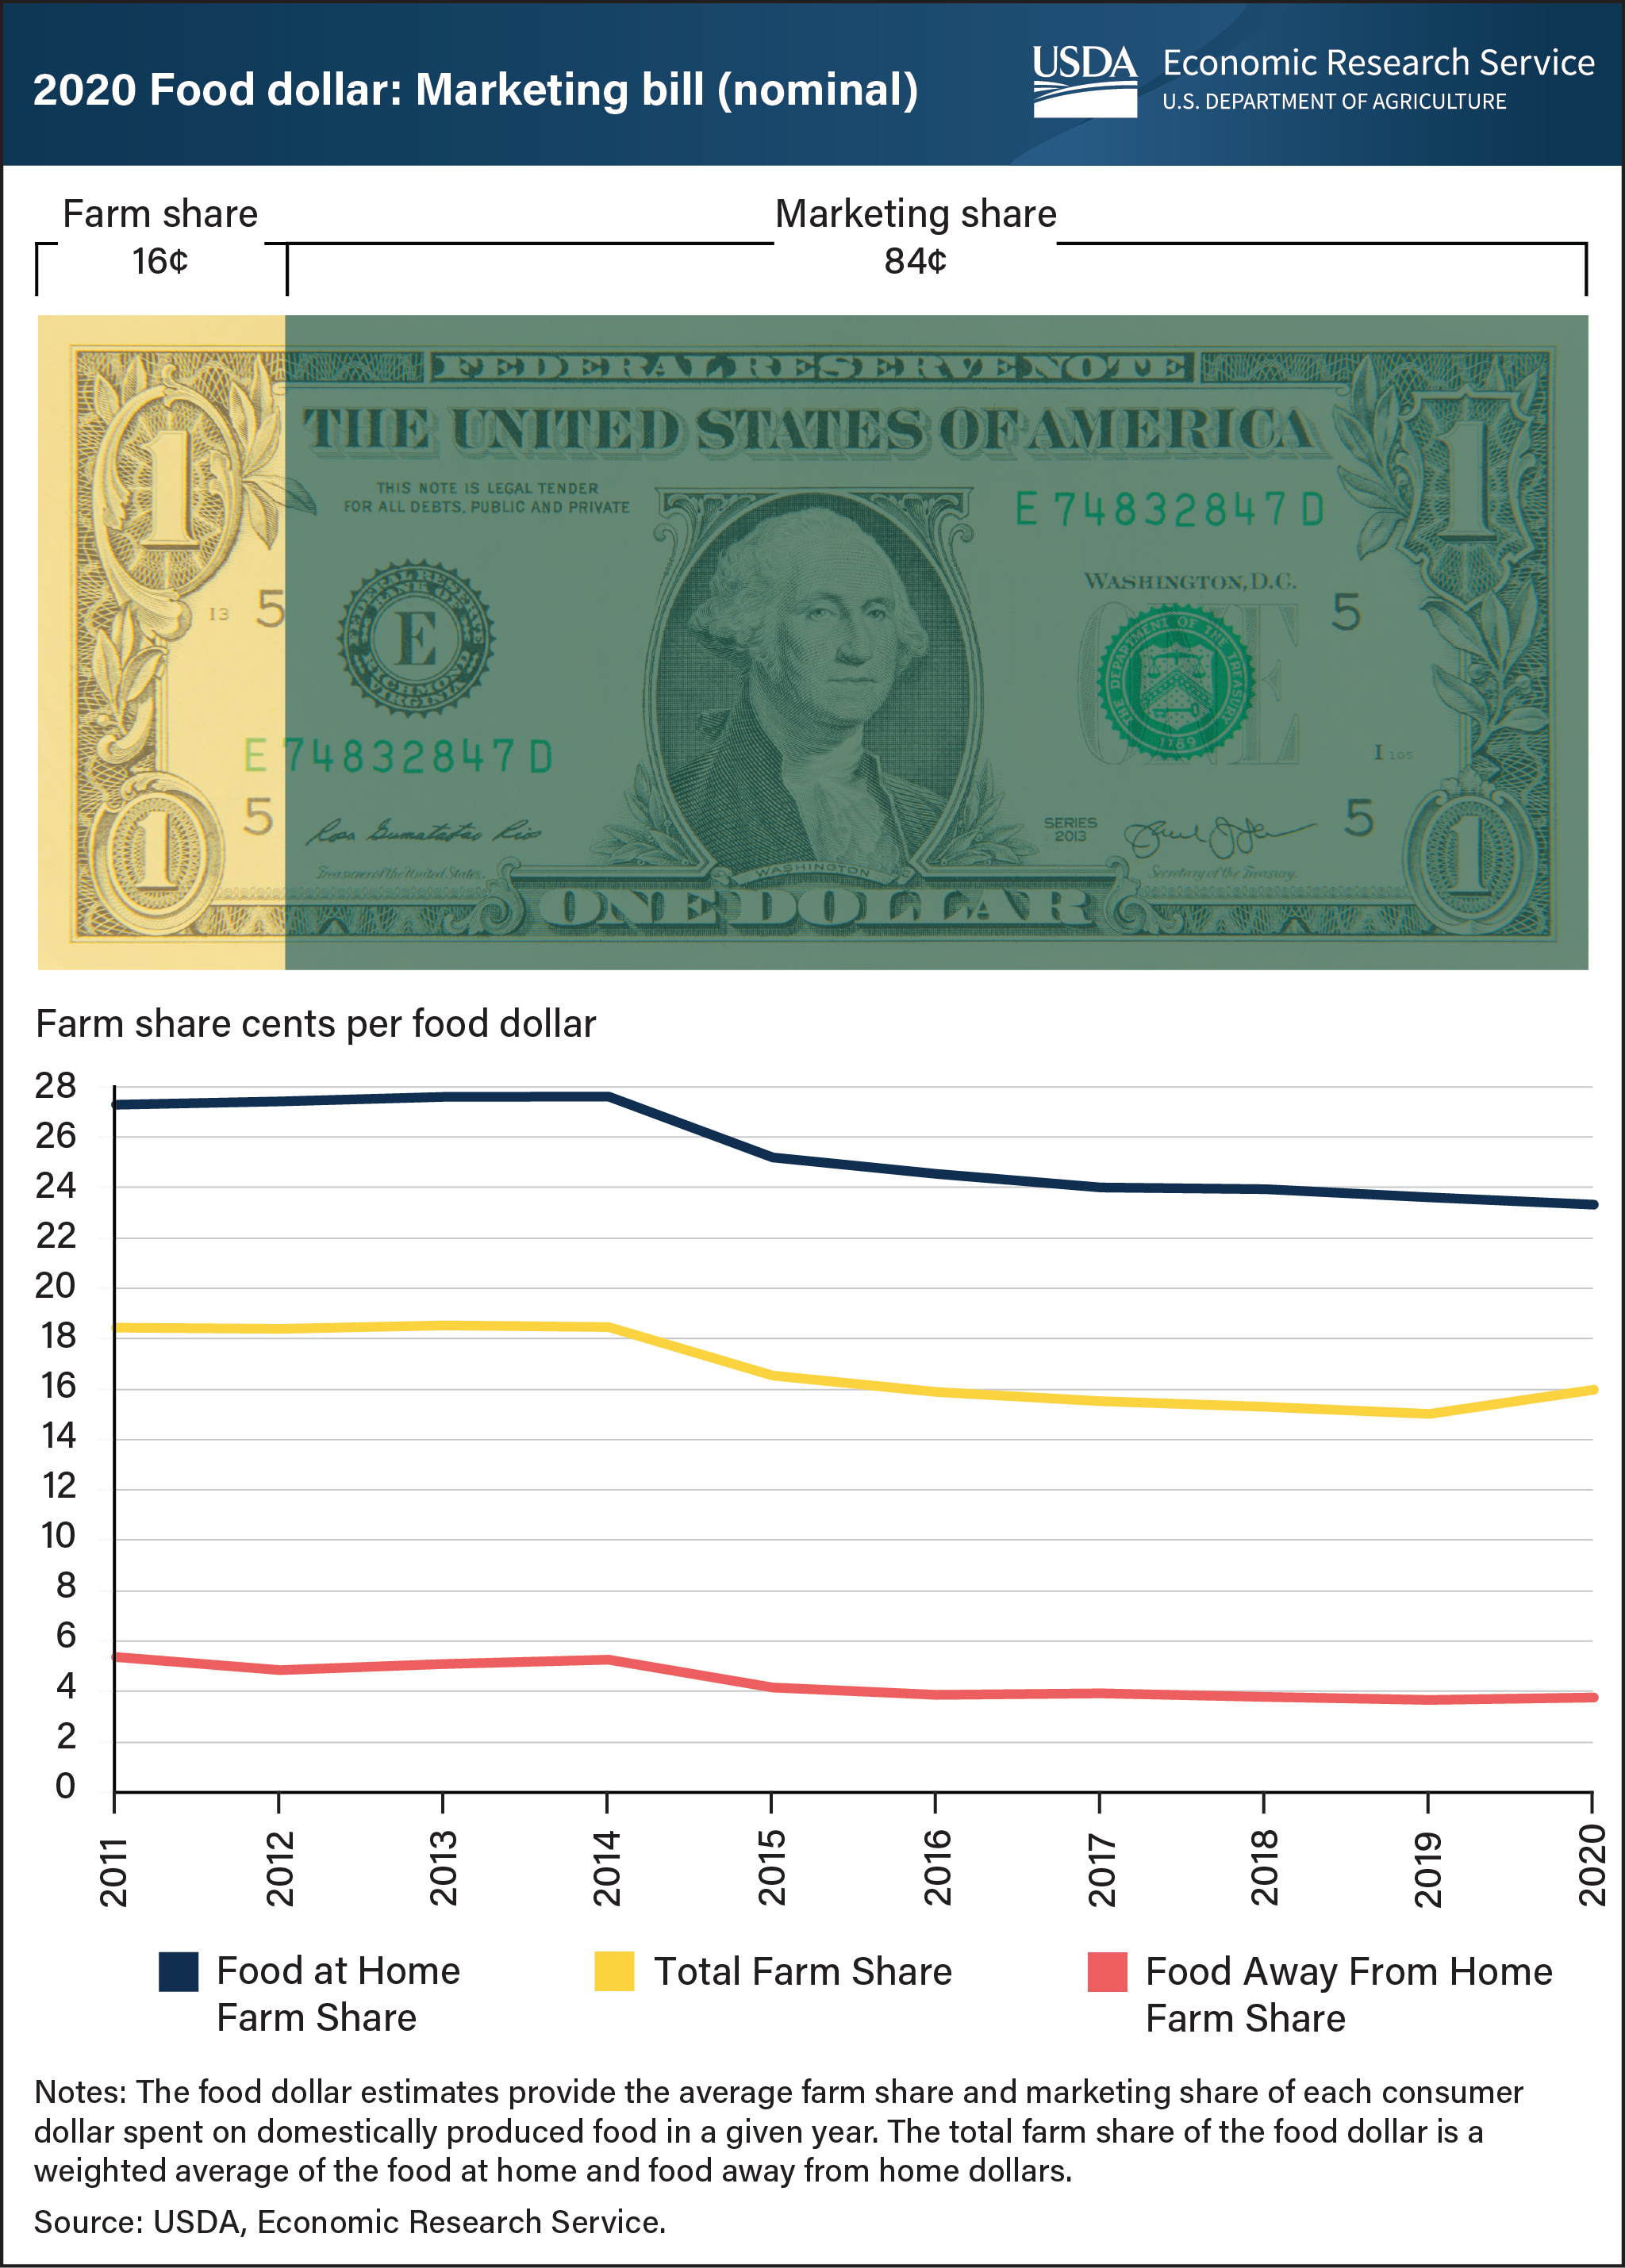
On average, U.S. farmers received 16.0 cents for farm commodity sales from each consumer dollar spent on domestically produced food in 2020, up from a revised 15.0 cents in 2019. Known as the farm share, the one-cent rise is the largest increase in nearly a decade. The marketing share, on the other hand, goes to food-supply-chain industries that move domestically produced food from farms to points of purchase, including costs related to packaging, transporting, processing, and selling to consumers at grocery stores and eating-out places. In the first year of the Coronavirus (COVID-19) pandemic, households redirected a substantial amount of their eating-out dollars, or food-away-from-home (FAFH) spending, toward food-at-home (FAH) markets such as grocery stores. Generally, farmers receive a smaller share from eating-out dollars because a larger portion is spent on preparing and serving meals at restaurants, cafeterias, and other food-service establishments. Historically, the farm share for FAH has averaged 24.3 cents, whereas the farm share for FAFH has averaged below six cents. Although farmers received a smaller share of retail dollars from food-at-home markets in 2020, they received a greater share of the overall food dollar because consumers made more purchases in FAH markets, where farmers receive a higher retail share than from FAFH markets. This gives the unusual result of total farm share rising more than both FAH and FAFH farm shares. The USDA, Economic Research Service (ERS) uses input-output analysis to calculate the farm and marketing shares from a typical food dollar, including food purchased at grocery stores and at eating-out establishments. The data for this chart can be found in ERS’s Food Dollar Series data product, updated March 17, 2022.