
Vaccination rates are higher in U.S. metro than in nonmetro counties, while the gap between persistently poor counties and counties that are not persistently poor is closing
- by Elizabeth A. Dobis, Thomas Krumel and Austin Sanders
- 2/7/2022
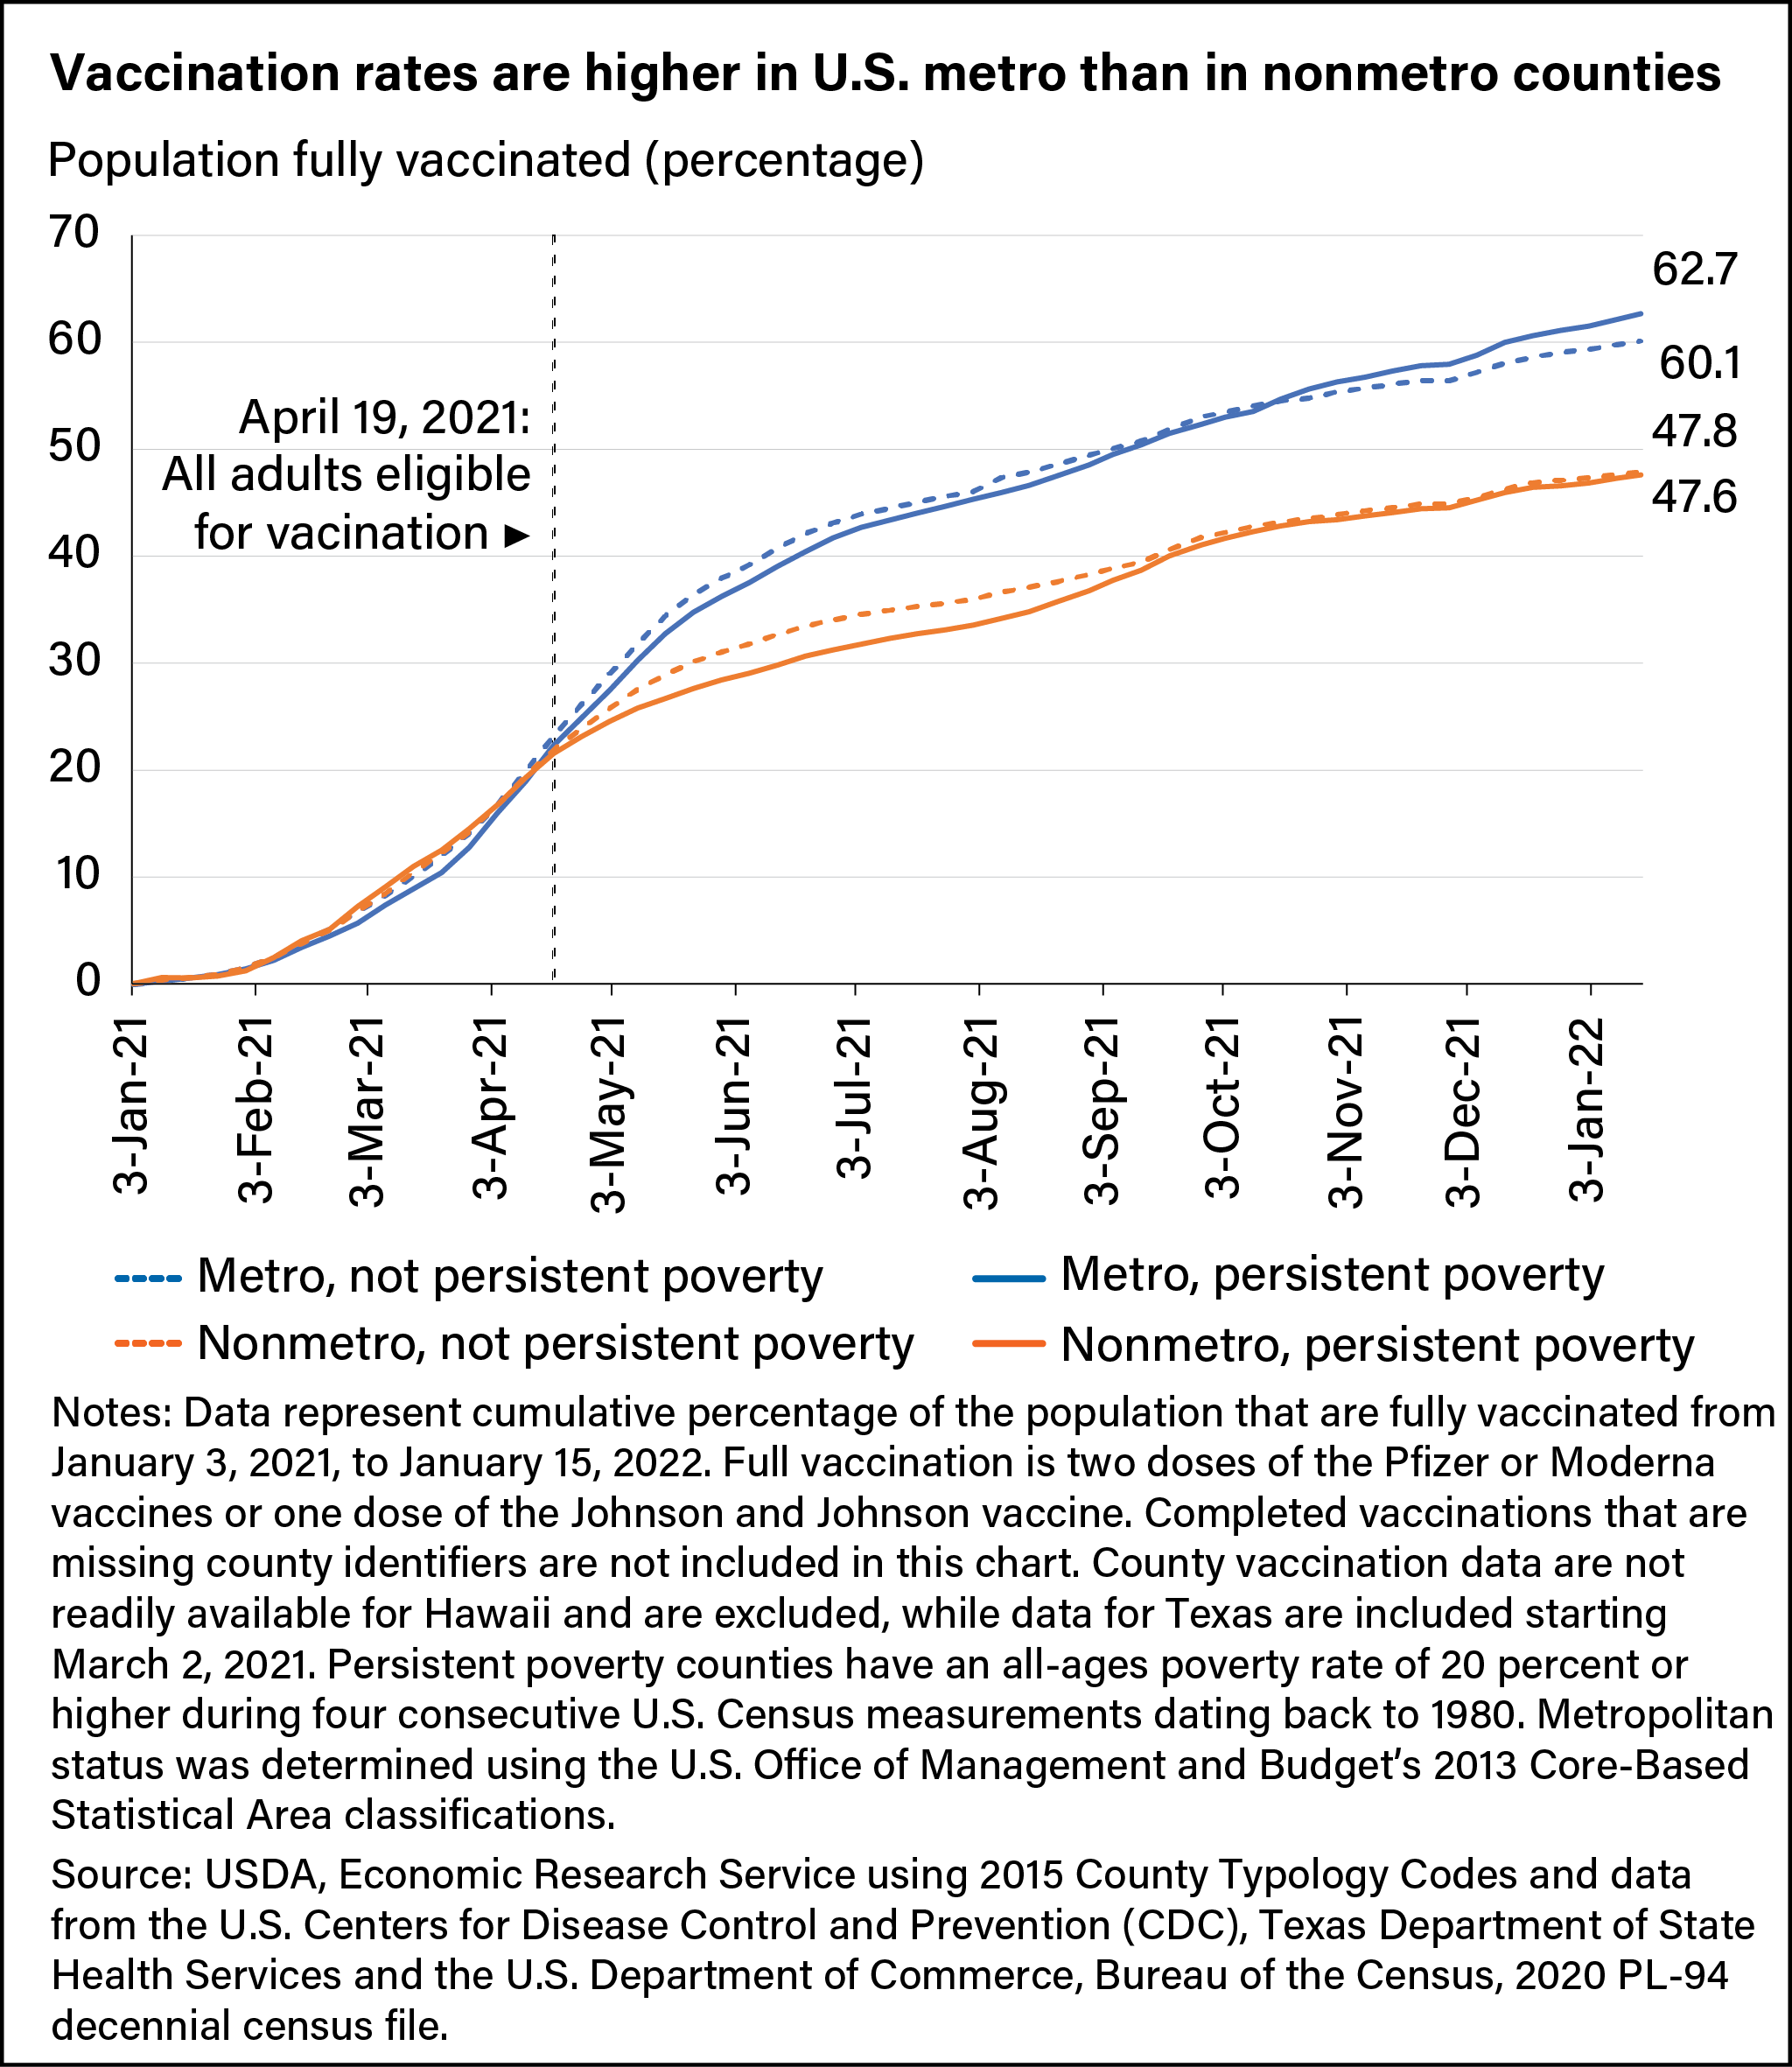
By late January 2022, the Coronavirus (COVID-19) pandemic resulted in 71 million cases and 860,000 deaths across the United States. The pandemic’s effects varied by location, however, with differences apparent in rural (nonmetro) and urban (metro) parts of the country, as well as between persistently poor counties and those that were not.