
Much of the expansion in irrigated acreage between 1949 and 2017 occurred in the Mississippi Delta and Northern Plains regions
- by R. Aaron Hrozencik and Marcel Aillery
- 1/12/2022
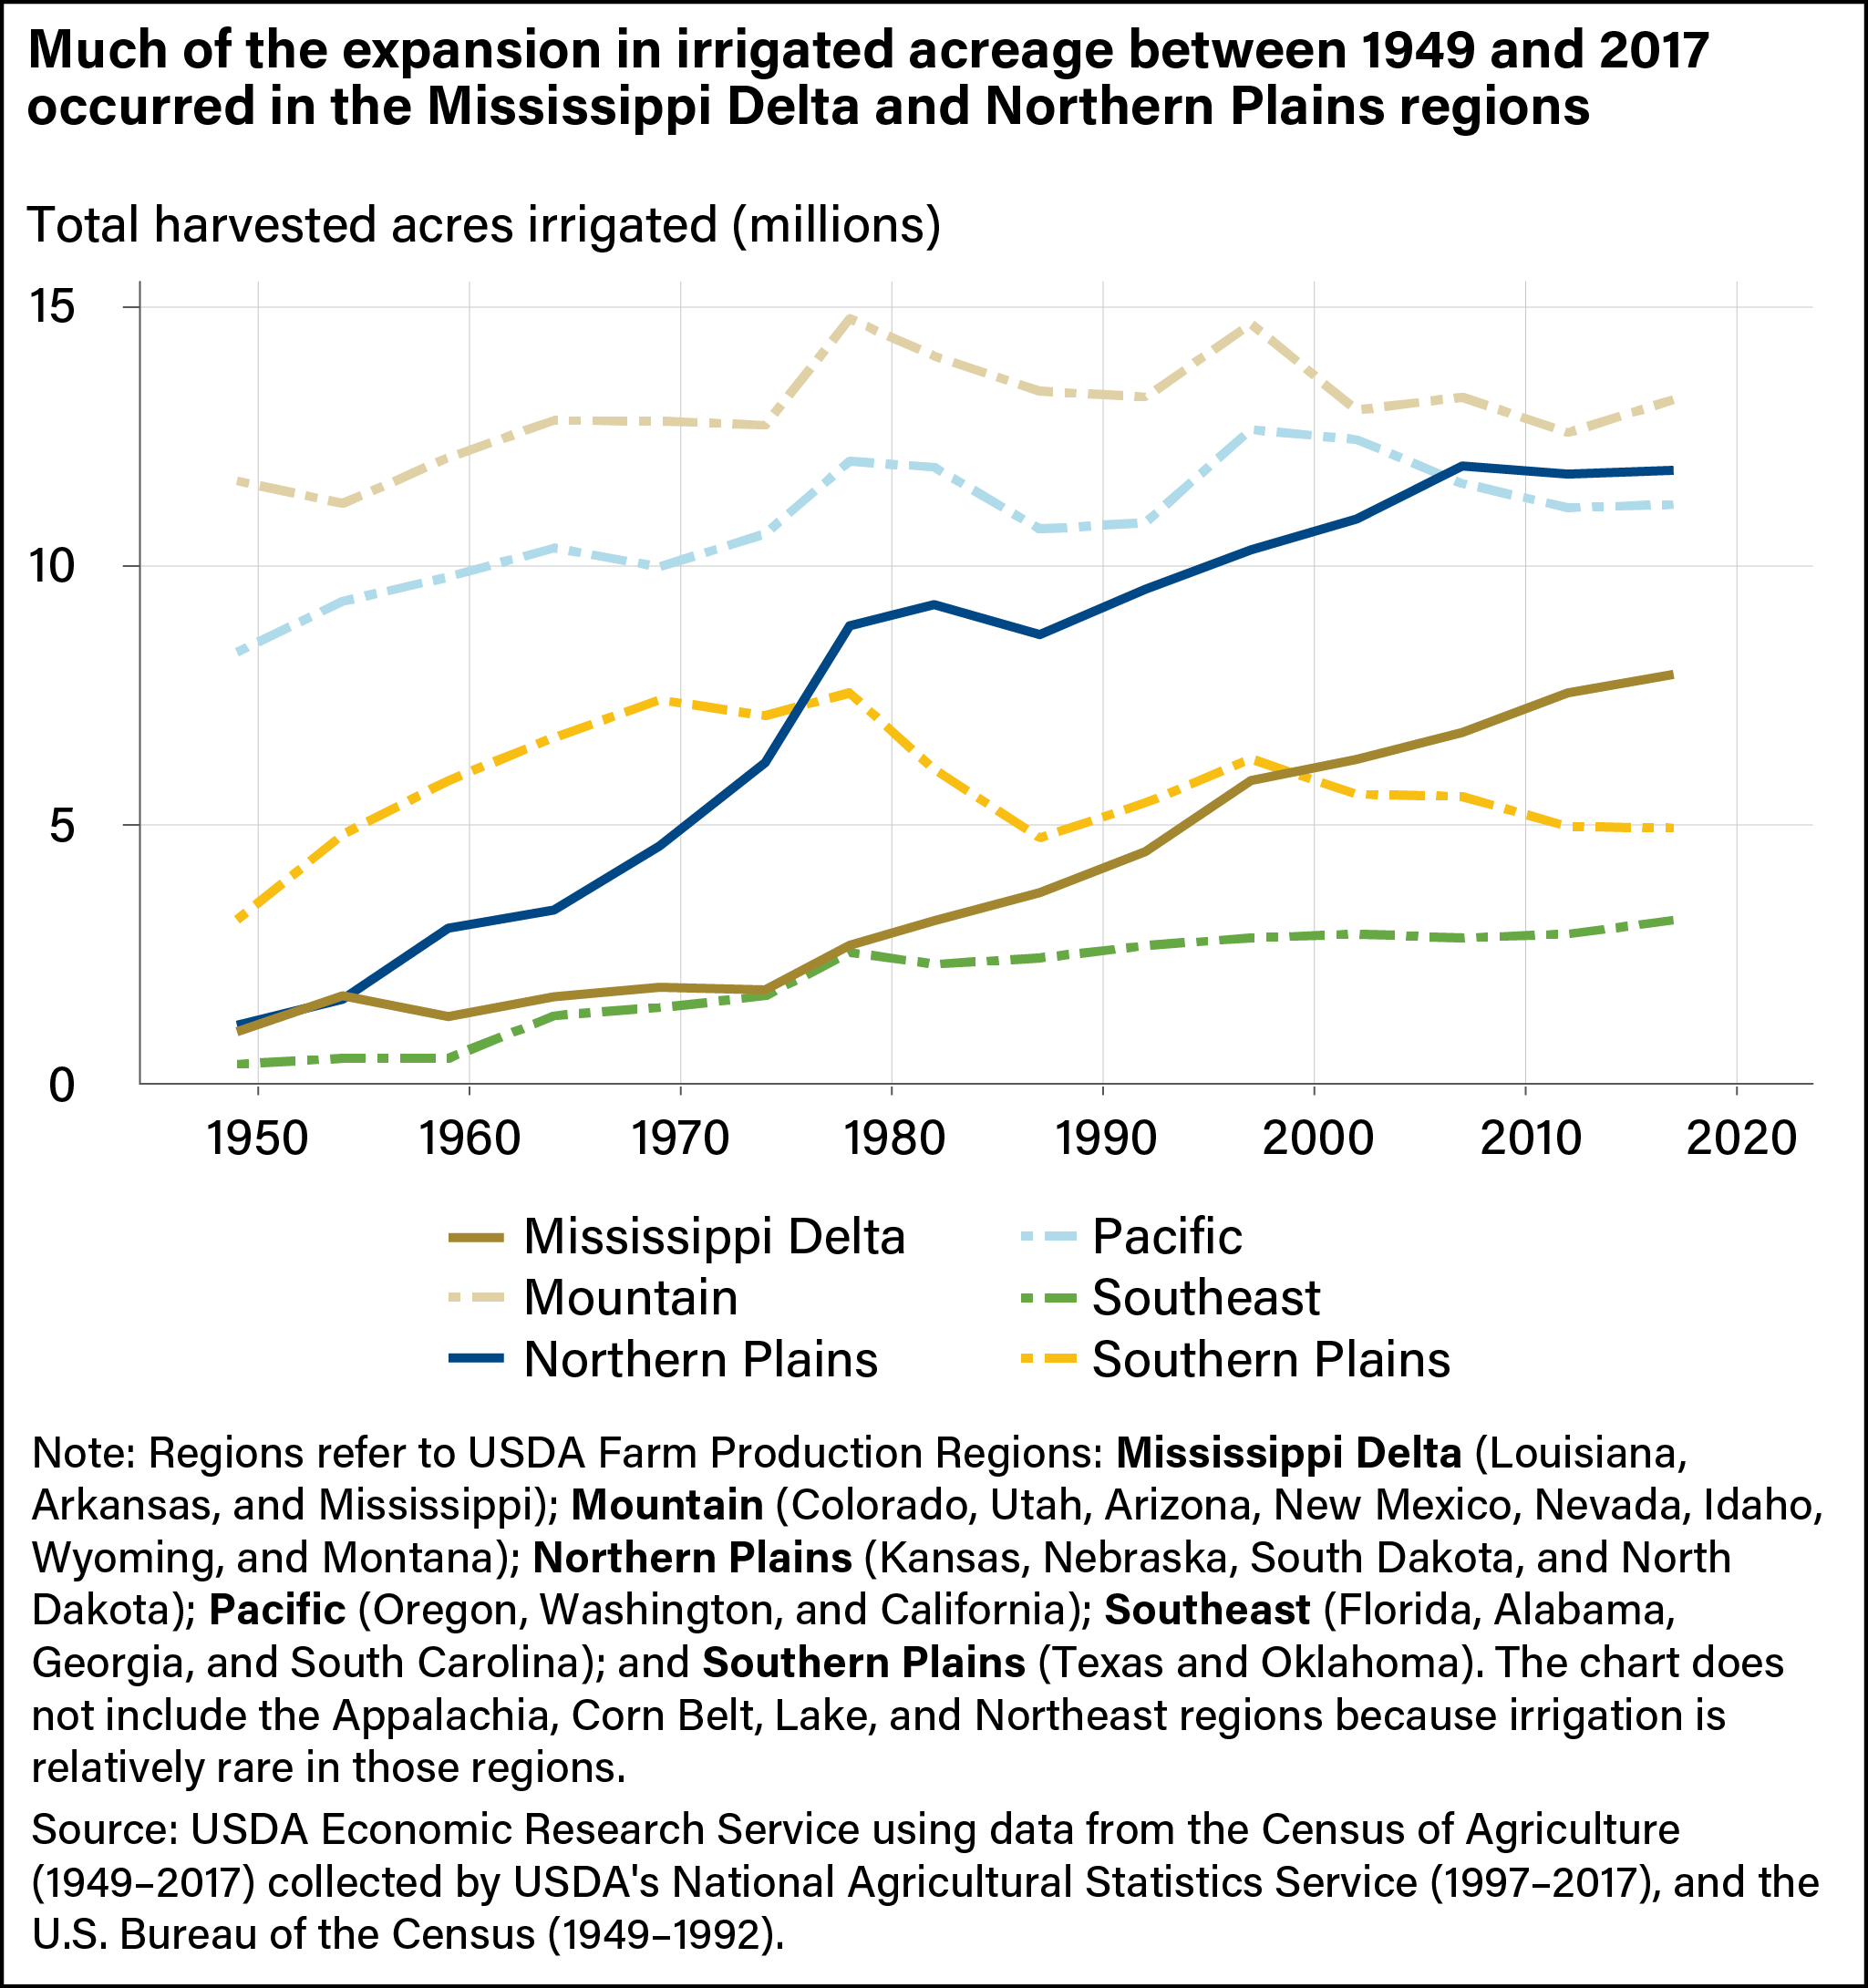
Line graph showing total harvested acres irrigated from 1949 to 2017 in different regions of the United States, including the Mississippi Delta, Mountain, Northern Plains, Southern Plains, Southeast and Pacific regions.